
Lipi — GoCharting's
Scripting Engine
Write custom indicators, strategy automations and data visualisations directly on the chart. Native access to orderflow metrics, COT data and a community of 7,000+ shared scripts.
Lipi is a powerful and flexible scripting language built directly into GoCharting. With access to orderflow metrics, COT data and a thriving community library, Lipi is the most capable scripting engine available in any web-based trading platform. No installs, no plugins — just open the Script Editor and start coding.
What You Can Build
Key Features
- ✓ Full API documentation with examples and code snippets
- ✓ Indicator-on-indicator support — chain multiple scripts together
- ✓ Plot shapes, labels, lines, filled areas and backgrounds from code
- ✓ Alert conditions defined in script — fires on chart or via notification
- ✓ Save and share scripts from the cloud — works across all devices
- ✓ Community support, self-help videos and guided tutorials
Learn & Reference
Community Scripts Showcase
Explore MoreDiscover what traders have built with Lipi. Browse all 7,000+ scripts →
This Indicator is used to mark value area zones inside the chart, which makes it static and displays the price point names at the end of the line
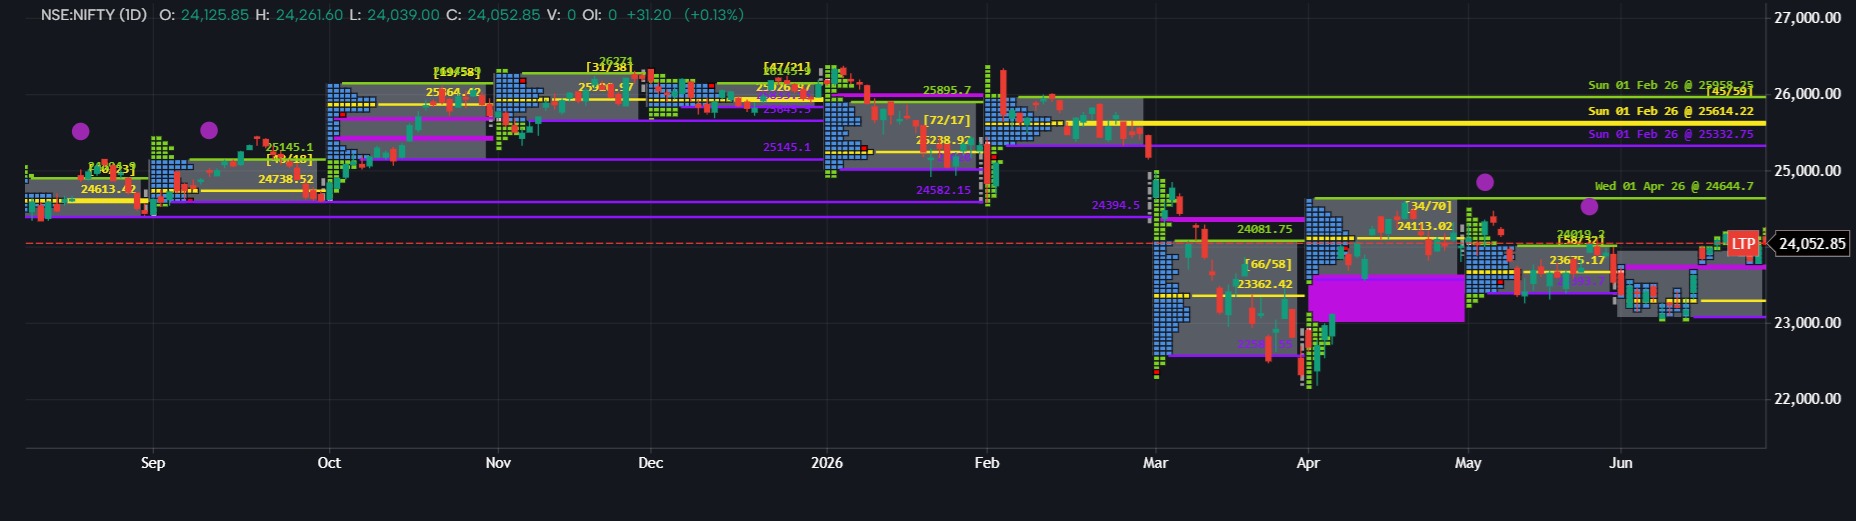
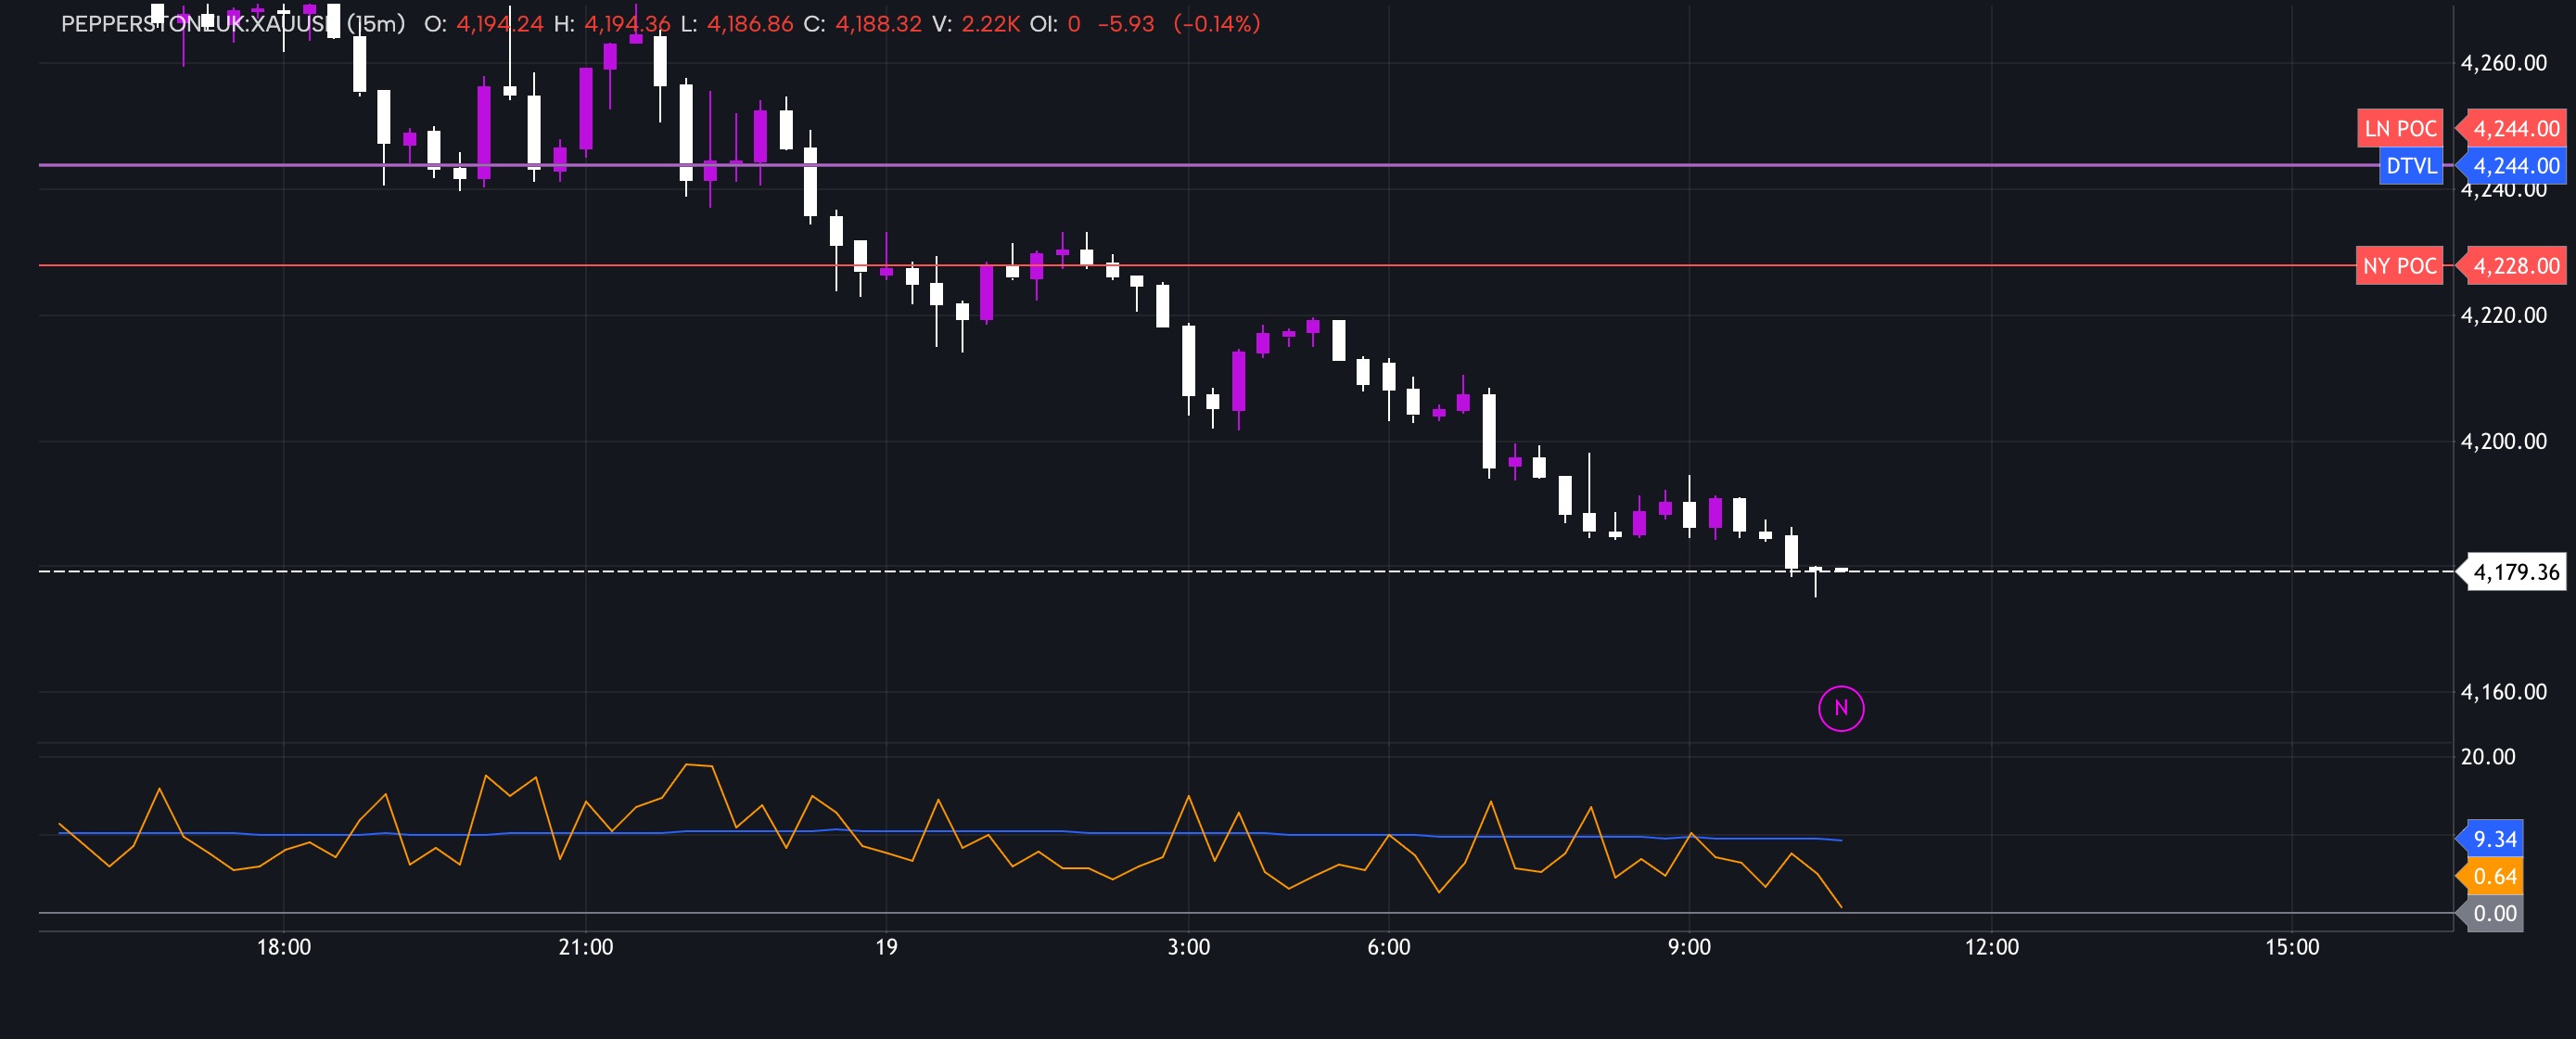
This indicator maps the Time Price Opportunity (TPO) Market Profile structure to track institutional order flow imbalances in real time. The core objective of this tool is to automatically isolate and highlight structural "Single Prints" within the intraday session.
A Single Print occurs when aggressive market participants drive price rapidly through a zone, leaving behind rows containing exactly one TPO block. These areas represent significant liquidity gaps and macro structural inefficiencies where two-way auctioning did not fully take place. By identifying these zones immediately upon a confirmed bar close, traders can pinpoint high-probability support and resistance areas, as price frequently treats unvisited Single Prints like structural magnets in subsequent trading sessions.
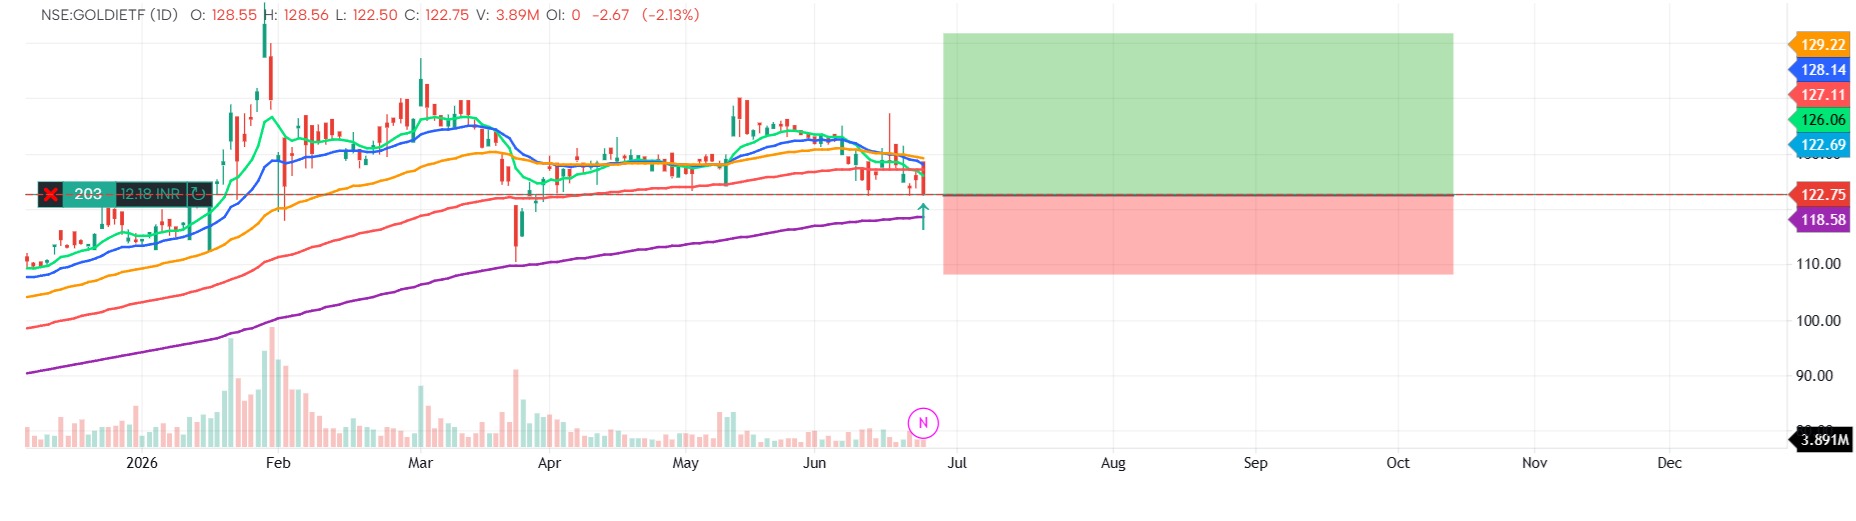
This, Indicator carries, multiple EMA, which can be changed in the setting tab as per the requirement of the user.
It helps plot, mutiple EMA Altogether,
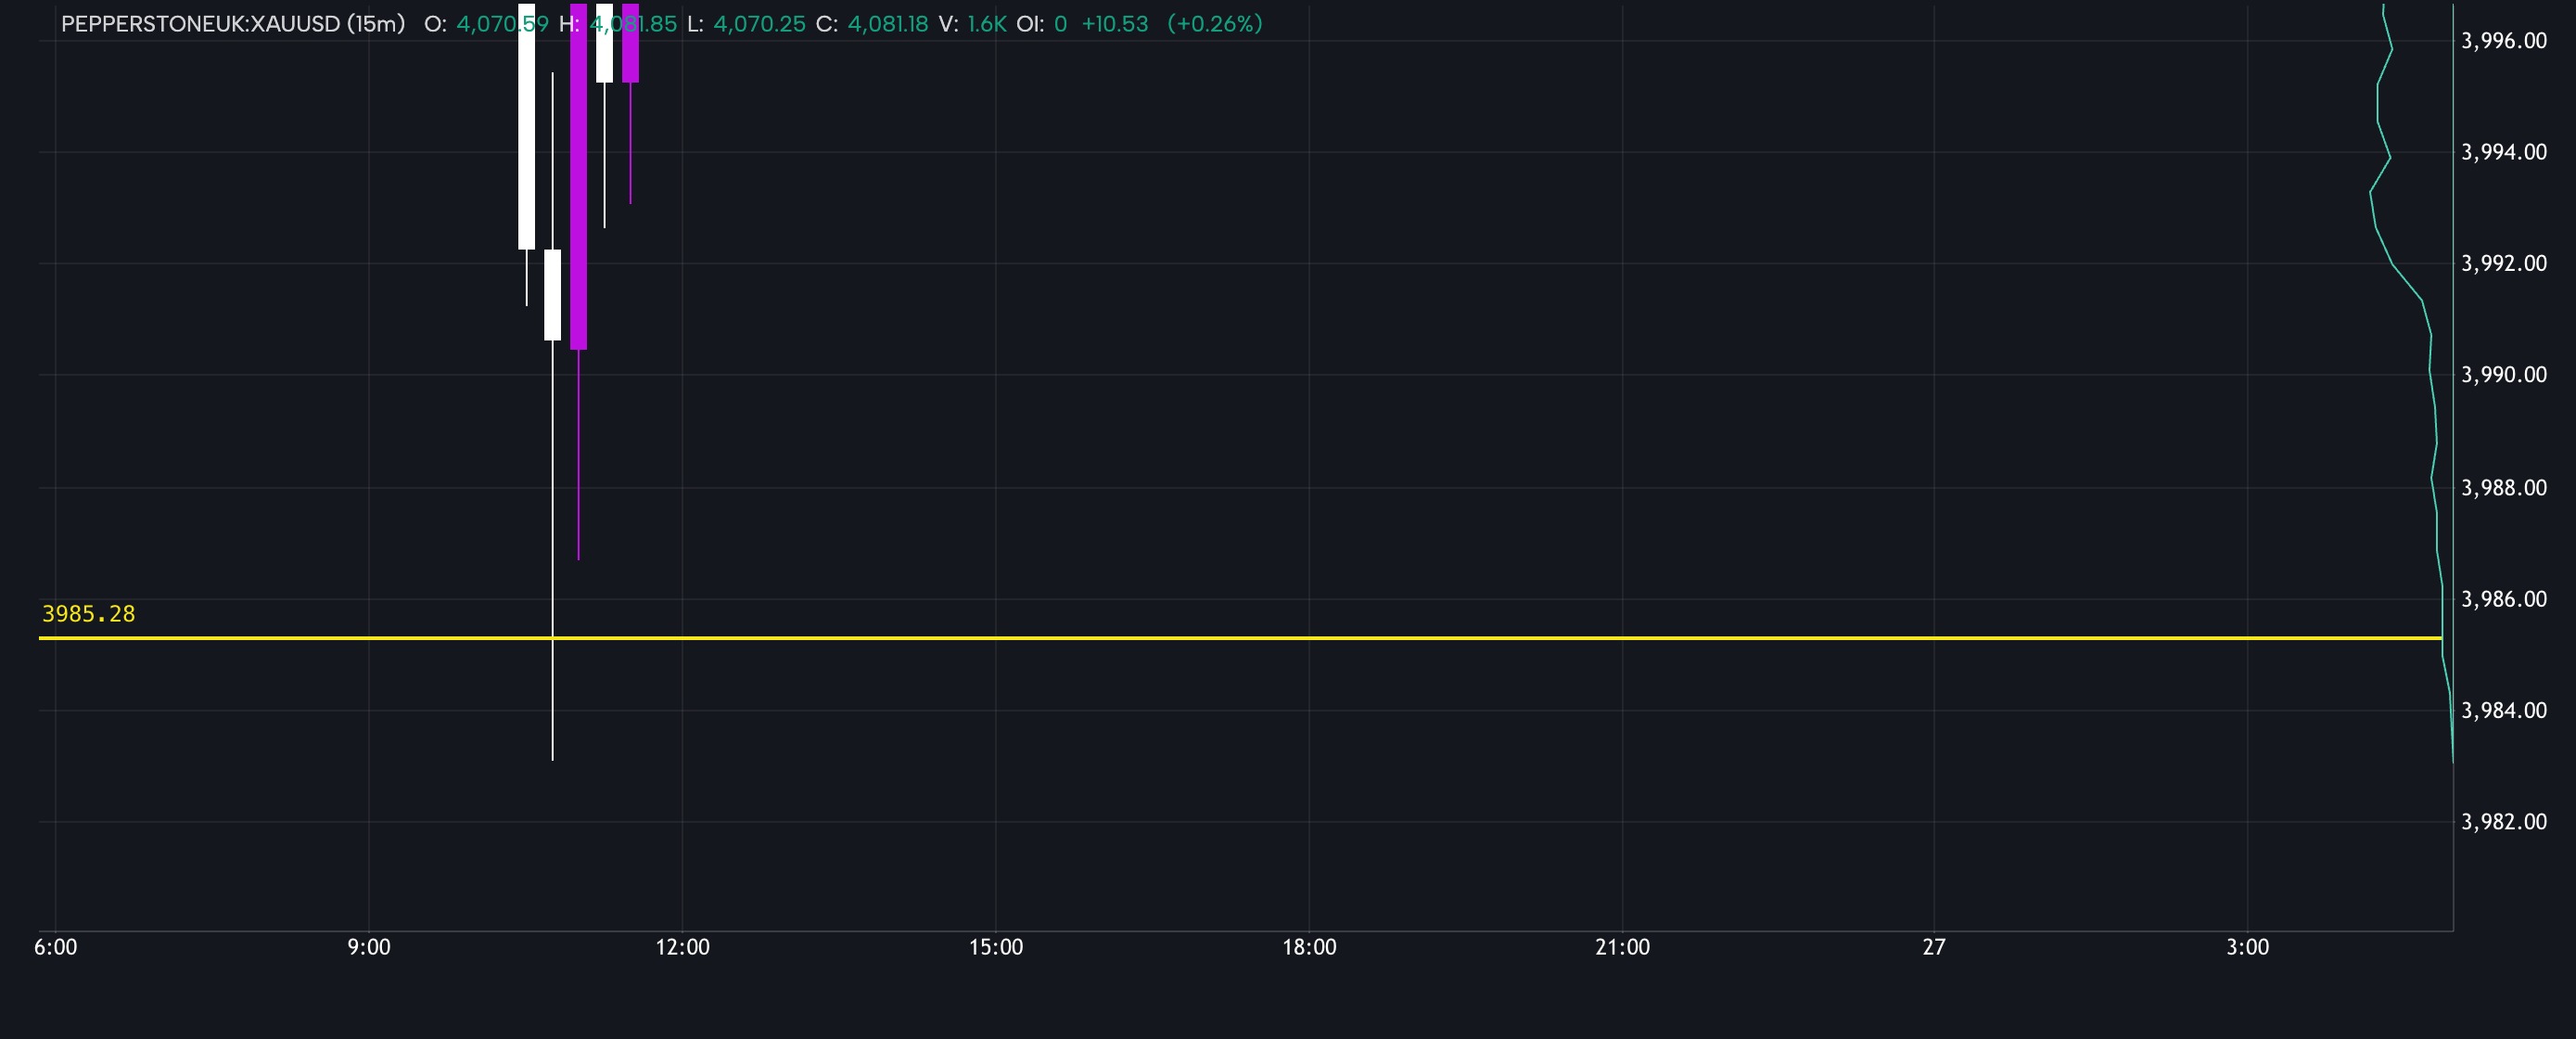
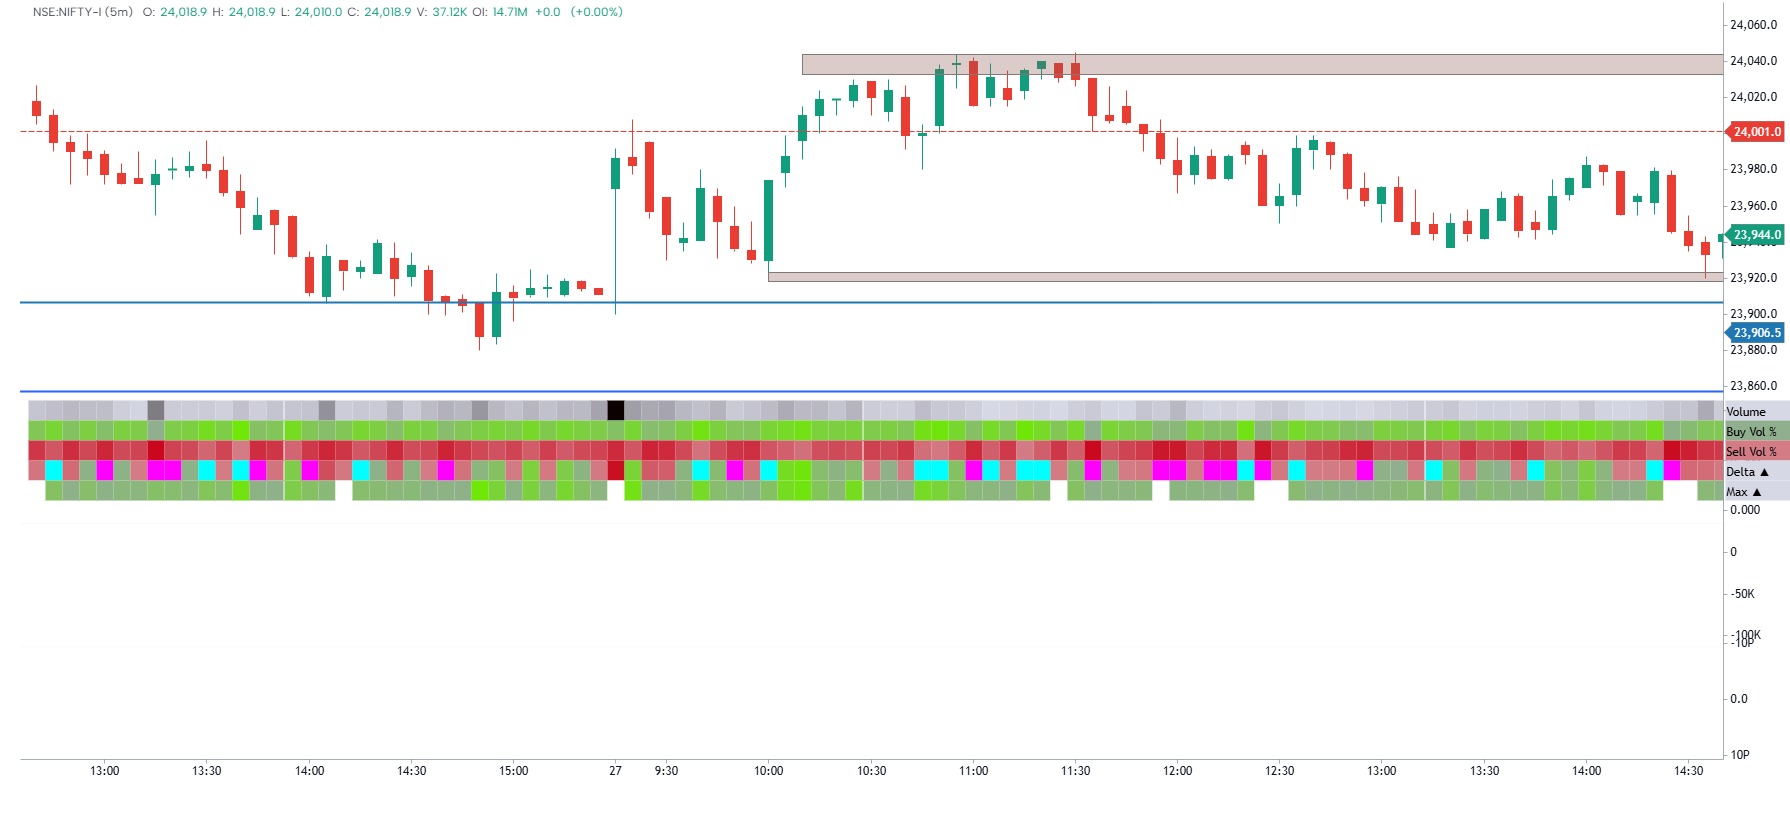
Shows buying and selling pressure. The green bubble show buyers bieeng absorbed in the market and the red bubbles show sellers bieng absorbed in the market.
This indicator helps us to find the volatility of the said asset in real time, by comparing it with the past and average volatility. You can adjust the no of candles it uses for calculation
This public, protected script utilizes specific structural market indicators designed to capture momentum shifts across various asset classes. The algorithm processes real-time volatility inputs to isolate high-probability trend continuations while implementing fixed structural risk boundaries to preserve trading capital.
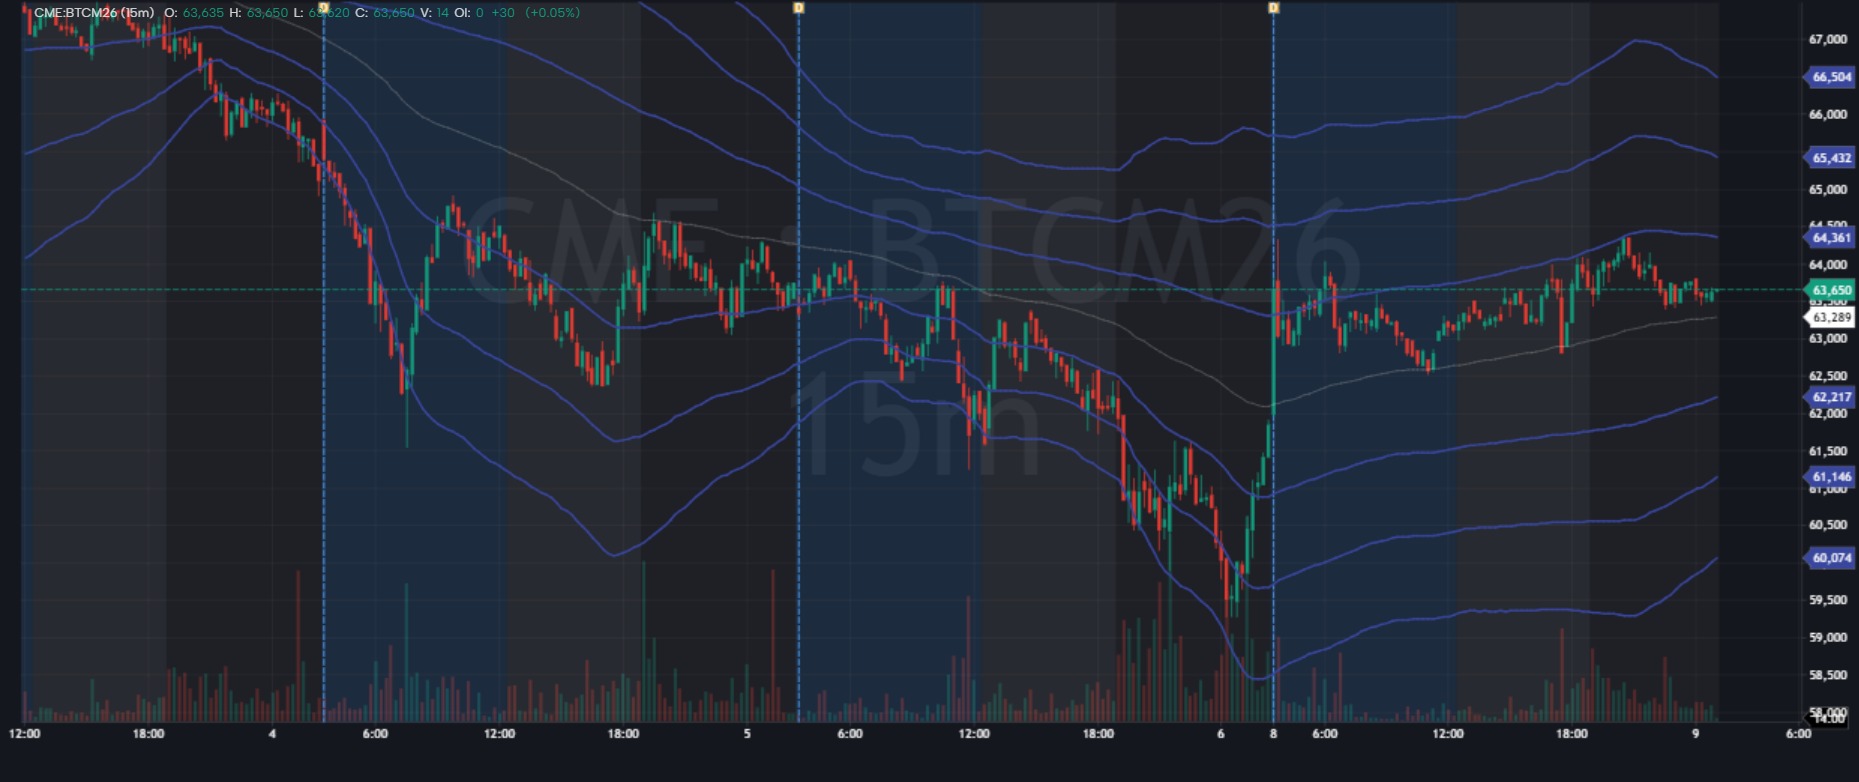
• EMA-based statistical mean with dynamic standard deviation bands.
• Visualizes price stretch using ±1σ, ±2σ, and ±3σ levels.
• Helps identify normal, extended, and extreme market conditions.
• Useful for volatility analysis, mean reversion, and trend monitoring.
• Adapts to changing market volatility instead of using fixed percentage levels.
• Designed for crypto, futures, indices, and other liquid markets.
• Not a trading signal generator; intended as a statistical context tool
HILEGA MILEGA BY NK SIR
USES 9 RSI 3 EMA AND 21 WMA
AVAILABLE FOR EVERYONE TO USE
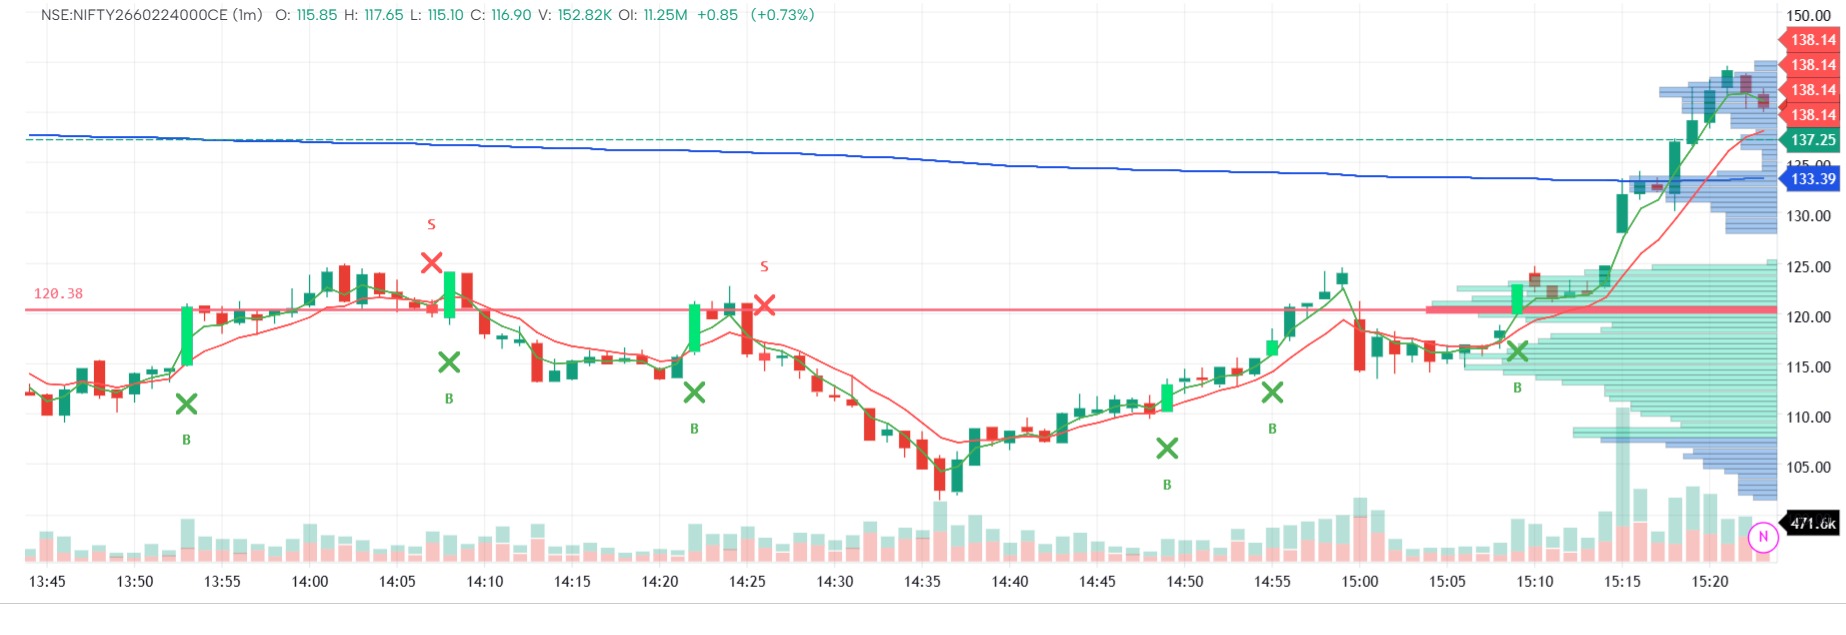
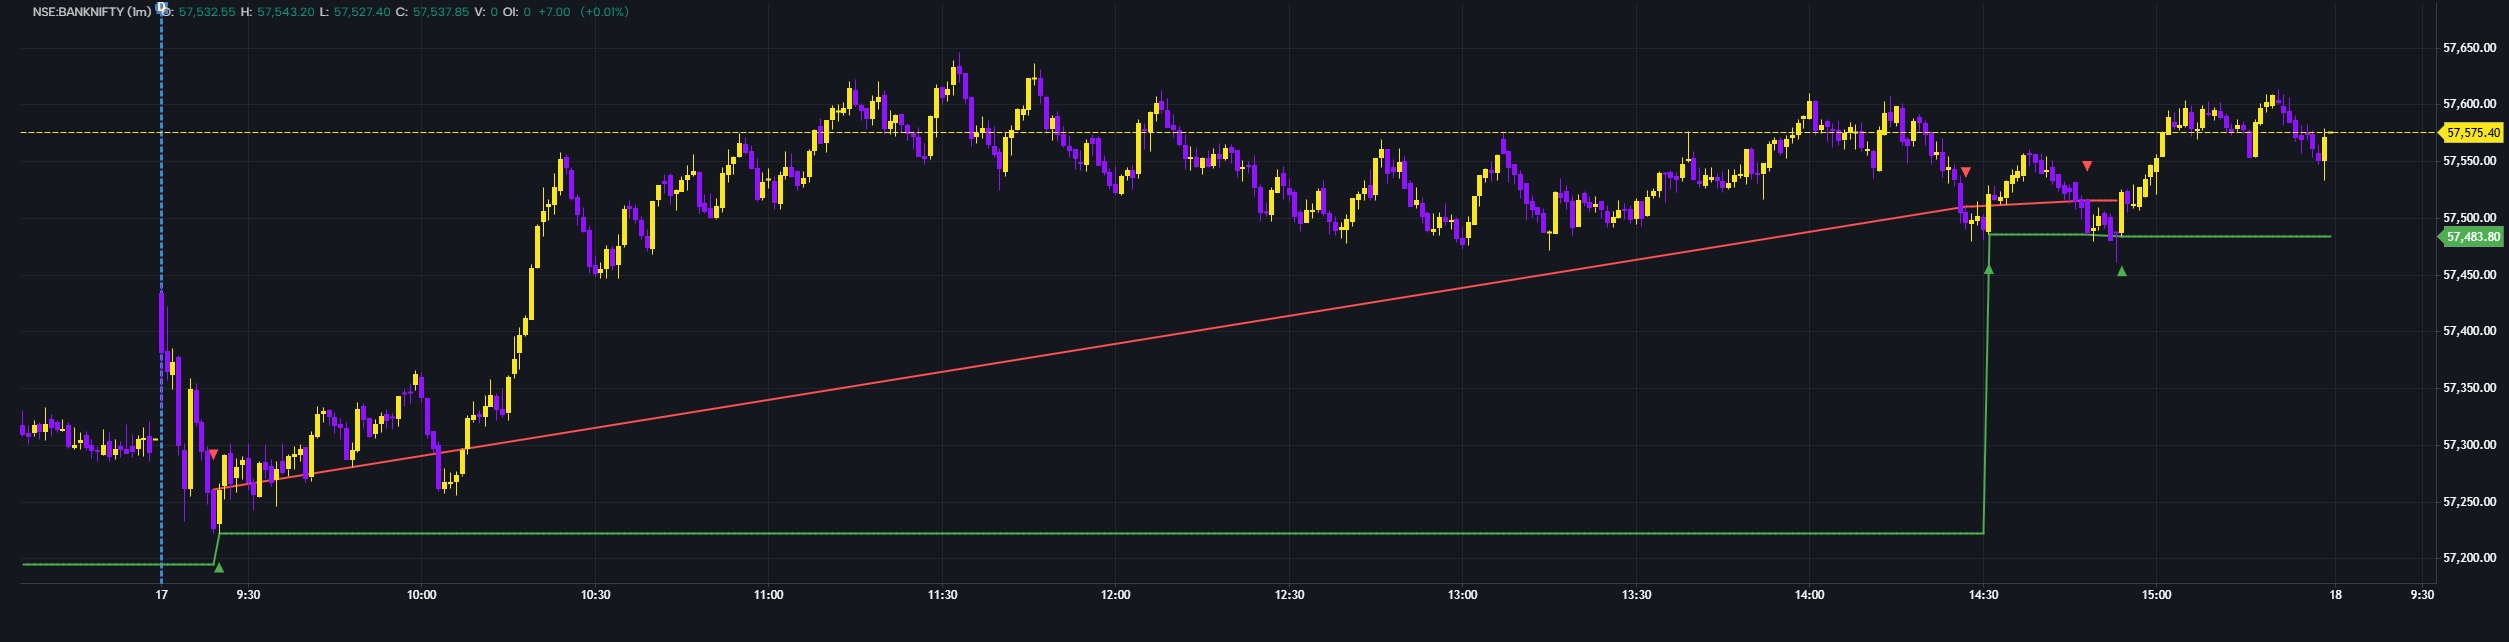
buy sell indicator for premium chart
perfect signal
its a master tool
green buy
red sell
powerul moving average comination
driven by orderflow and delta
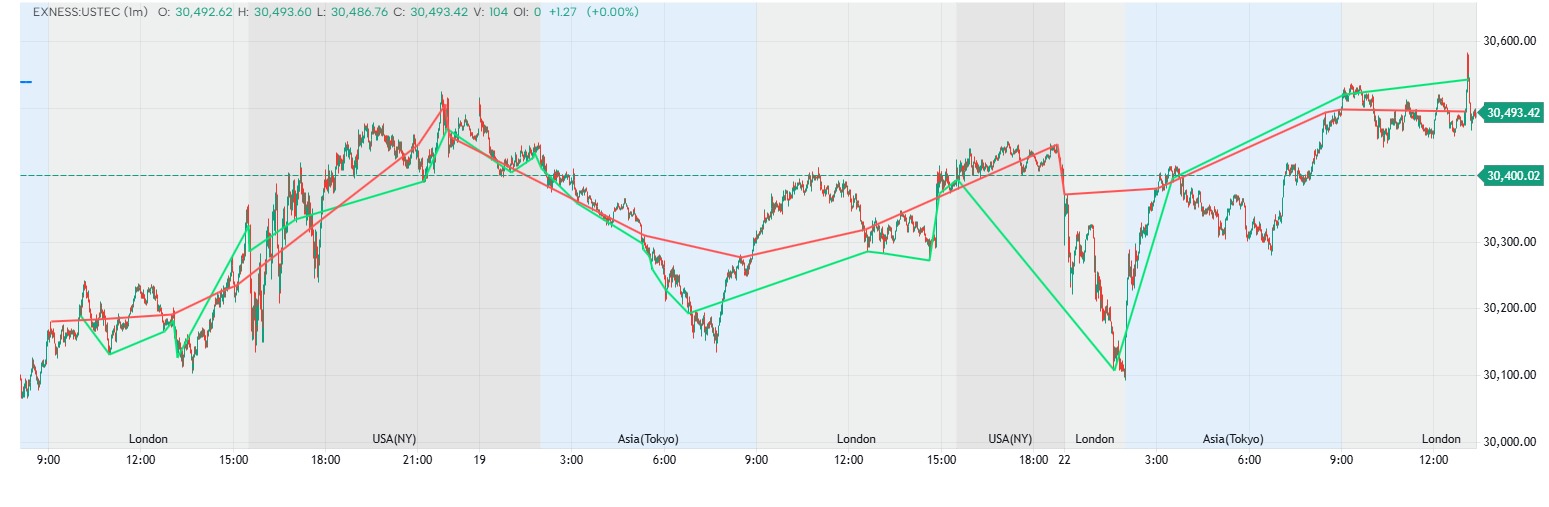
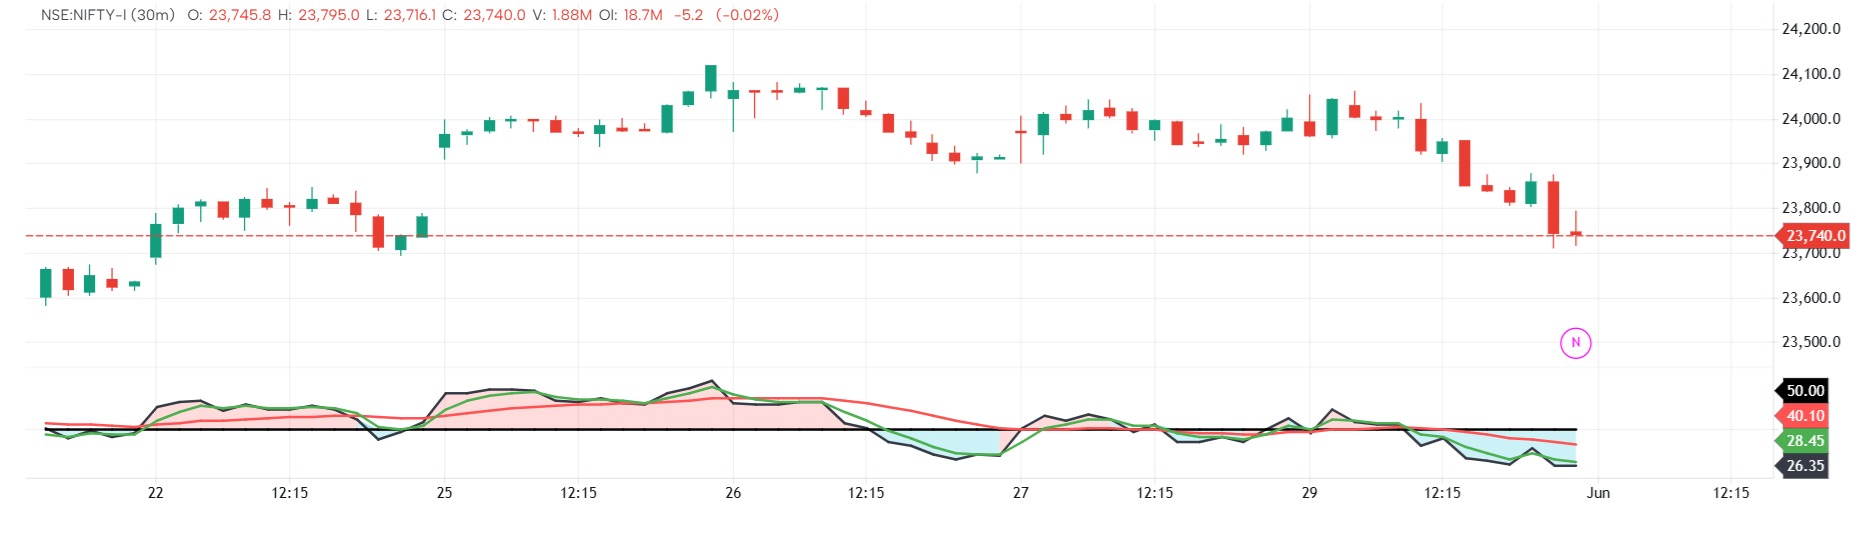
This script is a custom version of the “Chop Zone” indicator.
It measures the angle/slope of the 34 EMA and colors a histogram based on trend strength and direction.
The idea is:
Strong upward EMA slope → bullish colors
Strong downward EMA slope → bearish colors
Flat EMA slope → yellow (choppy/ranging market)
Supported Markets
Lipi scripts work across all GoCharting markets — NSE/BSE Futures & Options, CME Futures (/ES, /NQ, /CL, /GC), Forex & Crypto and Indian equities. Orderflow metrics (delta, buy/sell volume, OI) are available wherever the underlying data feed supports them.