Open Interest Z Score

This indicator is not just measuring Open Interest—it’s contextualizing participation in a statistical way, turning raw OI into a behavioral signal about market positioning.
🧠 What it really represents
Open Interest reflects how many contracts are open, but on its own it lacks meaning. This script transforms it into a Z-score, which effectively answers:
👉 “Is the current level of market participation unusually high or low compared to recent behavior?”
So instead of absolute values, you’re reading deviations from normal participation.
📊 Behavioral structure of the indicator
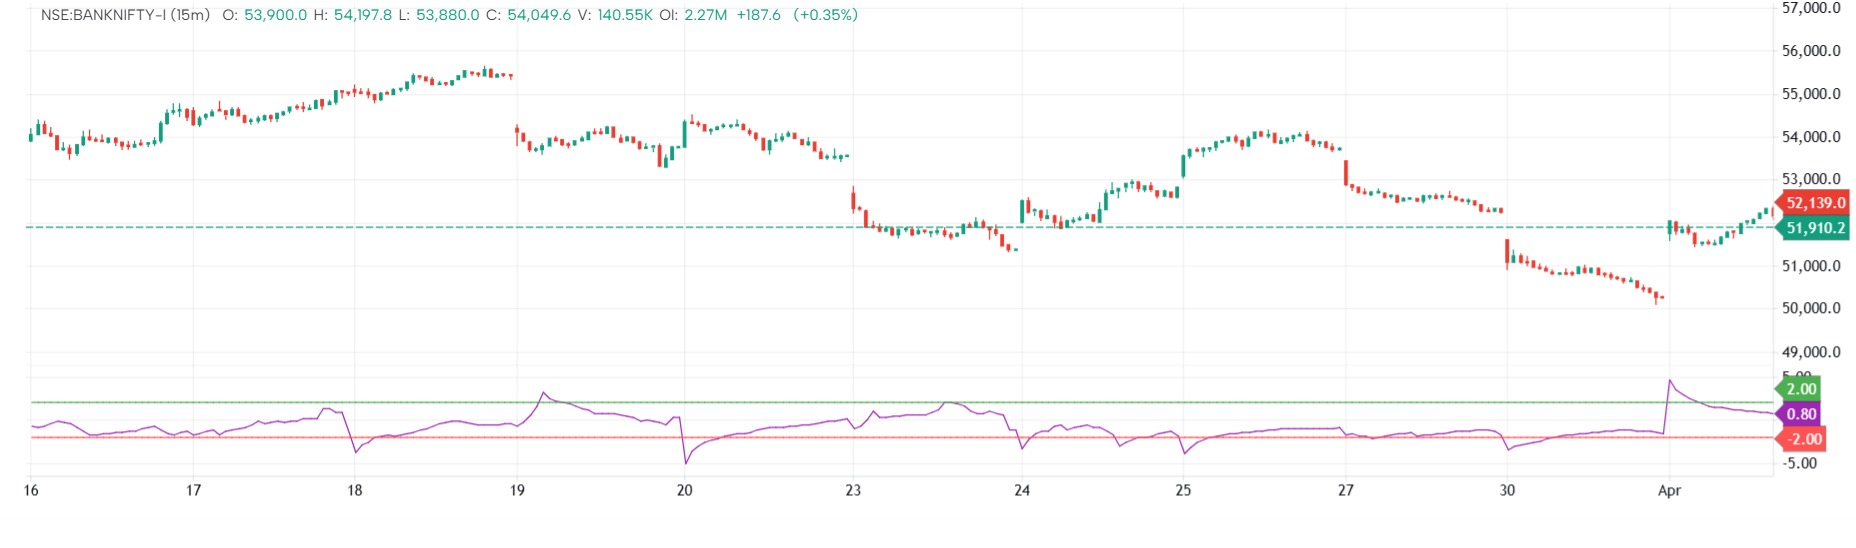
🟣 Z-score line (main signal)
This line shows how aggressively traders are entering or exiting positions relative to the past:
When it rises → participation is expanding faster than usual
When it falls → participation is shrinking or lagging
This makes it a second-order indicator—it doesn’t track price, but the commitment behind price.
🟢 +Z level (upper band)
This represents a statistical extreme in participation:
Market is seeing abnormally high positioning activity
Typically occurs when:
Trends are strong and attracting traders
Late-stage moves become overcrowded
👉 At this level, the market is often:
Either in a powerful continuation phase
Or approaching a saturation point where too many traders are on one side
🔴 -Z level (lower band)
This represents unusually low participation:
Traders are closing positions or staying inactive
Often seen after:
Liquidation events
Trend exhaustion
During sideways markets
👉 This reflects a lack of conviction, where the market is resetting before the next move.
⚖️ Market psychology behind it
This indicator is best understood as a crowd positioning thermometer:
High Z-score → “Everyone is getting involved”
Low Z-score → “No one is interested”
Markets tend to behave predictably at these extremes:
Crowded conditions → fragile, prone to sharp moves
Empty conditions → stable, but ready for expansion
🔗 Relationship with price (critical insight)
The real power comes from combining it with price:
1. Price ↑ + Z ↑
Strong trend with real participation
Indicates healthy continuation
2. Price ↑ + Z ↓
Price rising but participation dropping
Signals weak move / potential trap
3. Price ↓ + Z ↑
Increasing positions in a falling market
Can indicate aggressive shorting or panic selling
4. Price ↓ + Z ↓
Positions closing during decline
Suggests selling pressure is fading
⚡ Nature of extremes
The ±Z levels (like ±2) are statistically significant:
They mark rare deviations, not normal behavior
When reached, they often coincide with:
Breakouts fueled by new positions
Climax phases where positions become overcrowded
But importantly:
👉 Extremes don’t automatically mean reversal—they mean imbalance.
The information and publications are not meant to be, and do not constitute, financial, investment, trading, or other types of advice or recommendations supplied or endorsed by GoCharting. Read more in the Terms of Use.
↗ Related Scripts
Comments (0)
Loading comments…