Community Trading Analysis & Chart Ideas
Explore Market Insights · Technical Analysis · Trading Ideas
Discover trading ideas from the GoCharting community
Ai trend pro

Prueba EMAS
Primera estrategia cruce de EMAS

 Bullish
5 year of Bitcoin
Everyone say we want profit now but If you want a legacy on it you will take a time minimum five year beacuse when the market is big they will take time to move bullish for reference charts SS So when ever you feel we have no Profit Always ask yourself how many time you give to your investment you will find all the answer.

 Bearish
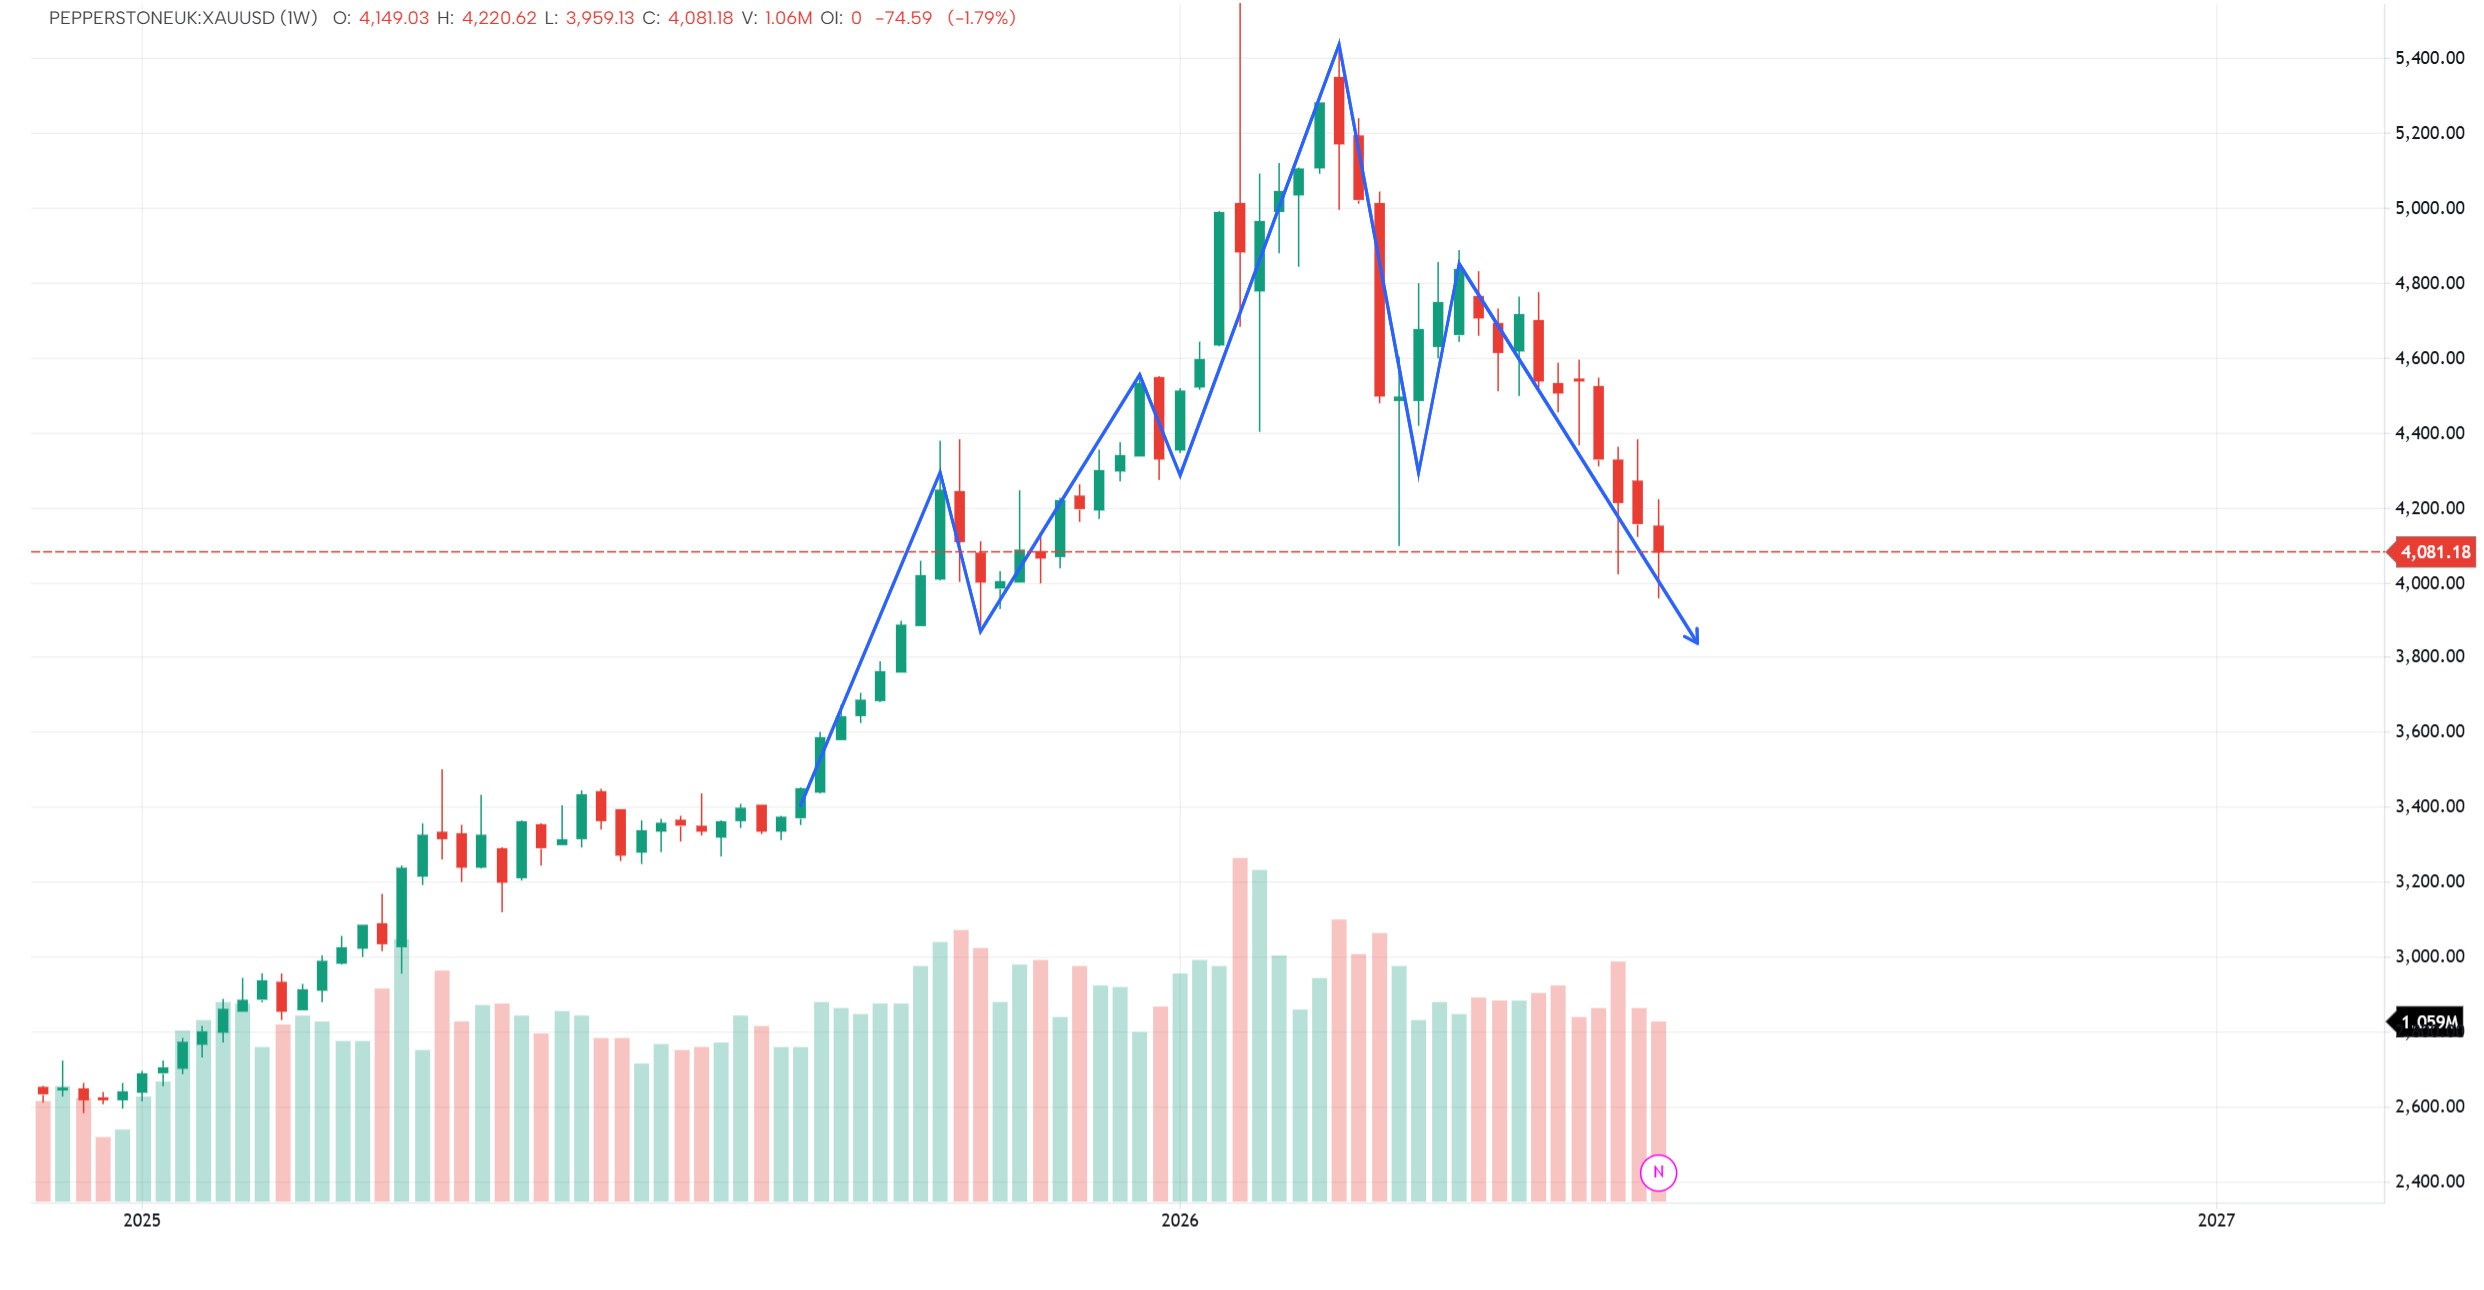
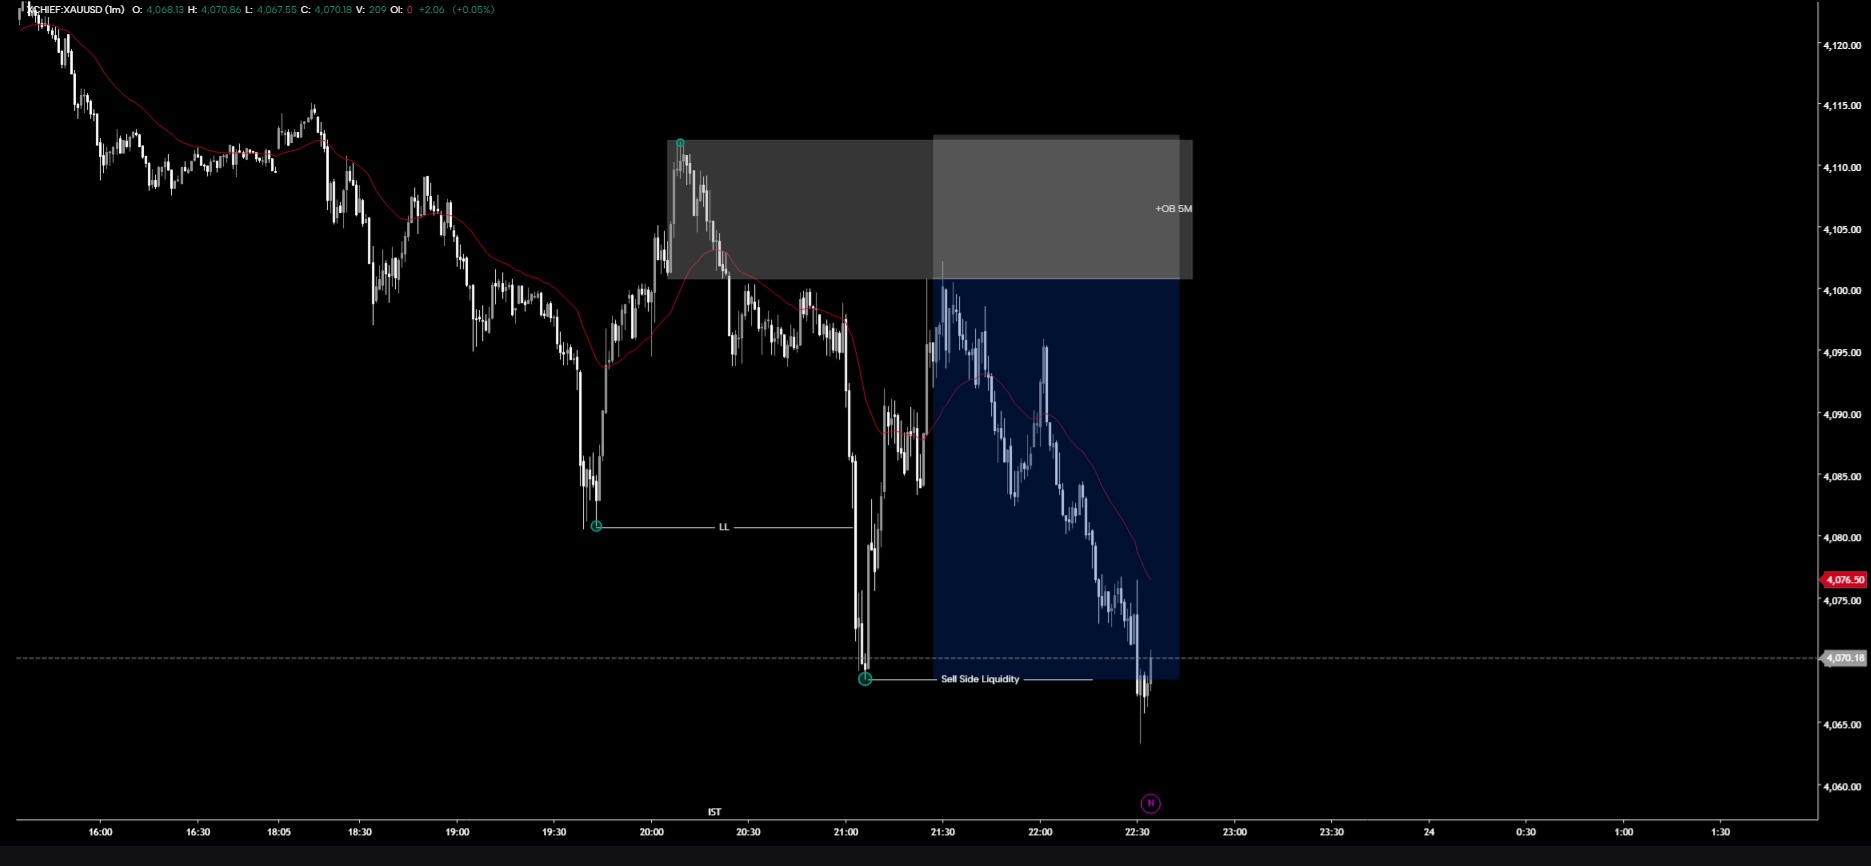
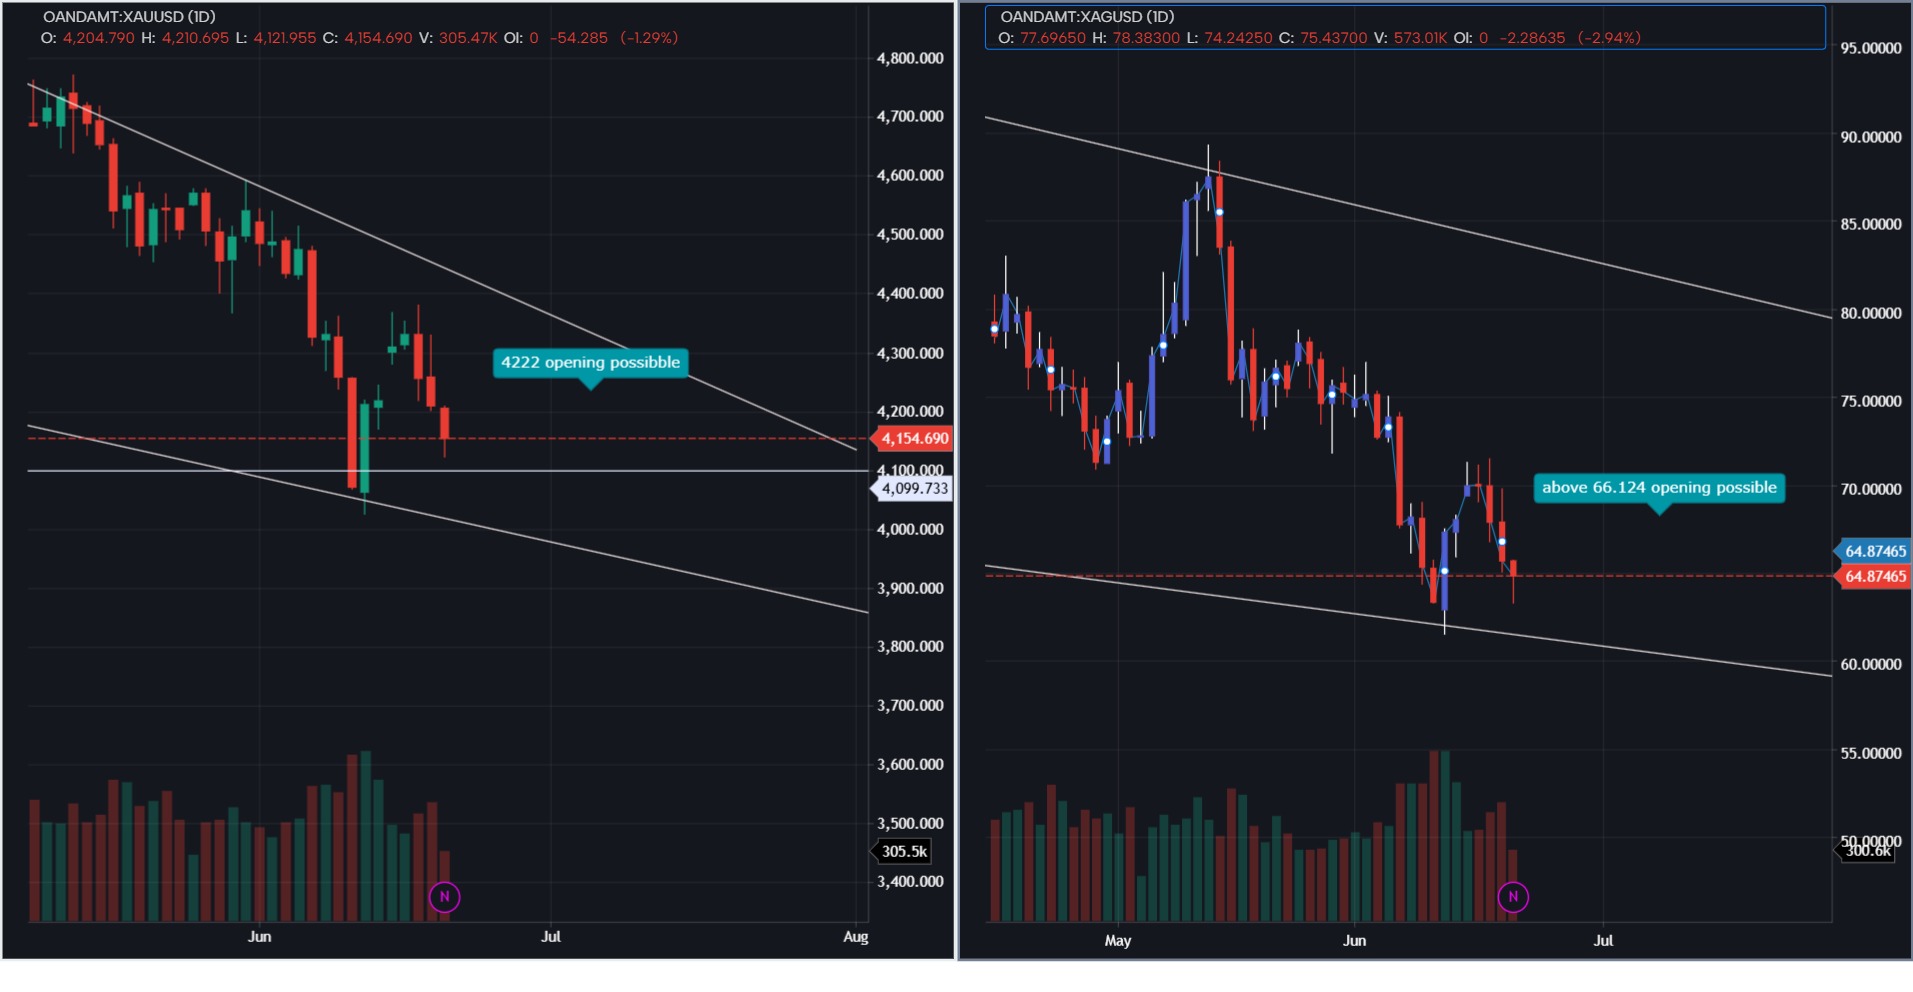
Gold bearish next week
I expect gold retest 4220 next week and continue it is journey to testing 3806. This point is very crucial becuase at this point gold testhistorical support 3400 bu before that I expect the retest to 42200.

![Absorption Bubbles Pro [Orderflow Confirmed]](https://gocharting.com/screenshots/97257f9c-606d-44ee-bdfa-f39691e57d61.png) neutral
neutralAbsorption Bubbles Pro [Orderflow Confirmed]
Flags candles where one side was the dominant, above-average aggressor (via order-flow delta) but price still rejected and held against them — a sign the other side may have absorbed that pressure. - Lime bubble below a bar = possible BUYER absorption: sellers were dominant (delta clearly negative) with a volume spike, but the bar rejected its low. - Red bubble above a bar = possible SELLER absorption: buyers were dominant (delta clearly positive) with a volume spike, but the bar rejected its high. Bubble size scales with how unusual the volume/delta dominance was. Confirmed-hold markers: a bigger marker appears on the absorption bar once price holds for N bars after (default 3) without breaking it -- separating absorption that stuck from absorption that failed. Why order flow, not wick shape alone: a long wick with high volume can't tell you who was aggressive — could be real absorption, or a normal reversal where one side won outright. This requires delta to confirm direction first. Usage: treat flagged bars as a reason to look closer at a level you already cared about (support/resistance, session high/low) — not a standalone signal. Cross-check against a footprint chart when available; this only sees bar-level delta, not where volume concentrated within the bar. Inputs: volume/delta multipliers, wick ratio, confirmation bars, tolerance, bubble sizes. Educational only, not financial advice. Backtest before relying on it.

 Bullish
GOLD 4H BIAS BULLISH MOVE
Best move on have seen in one month, gold have been fallin abbout for the past one month but just now gave an entry. 1h confirmation on potential direction, 15m in entry using bullish breker block and cisd. 1h confirmation oAn potential direction, 15m in entry using bullish breaker block and cisd. FULL TP YET AGAIN TODAY

 Bullish
eurusd 15m bullish move
4 hour bullish bias, 1h confirmation bias, cisd 1h, target from 1h, entry on 15m with cisd bullish breaker DM EMAIL (kolawolevicky23@gmail.com) IF YOU NEED TO GROW YOUR ACCOUNT
 Neutral
warden Fibonacci retracement + ema 10 20 50 100 200
high to low fibonacci + ema 10 20 50 100 200 , ffggdrytryrturturtherhetyrturthfghfghfghfhfghyhjtryujjjjjjjjjjjjjfndudiur7seriuthuiet87erterteurt78eruheurh9r

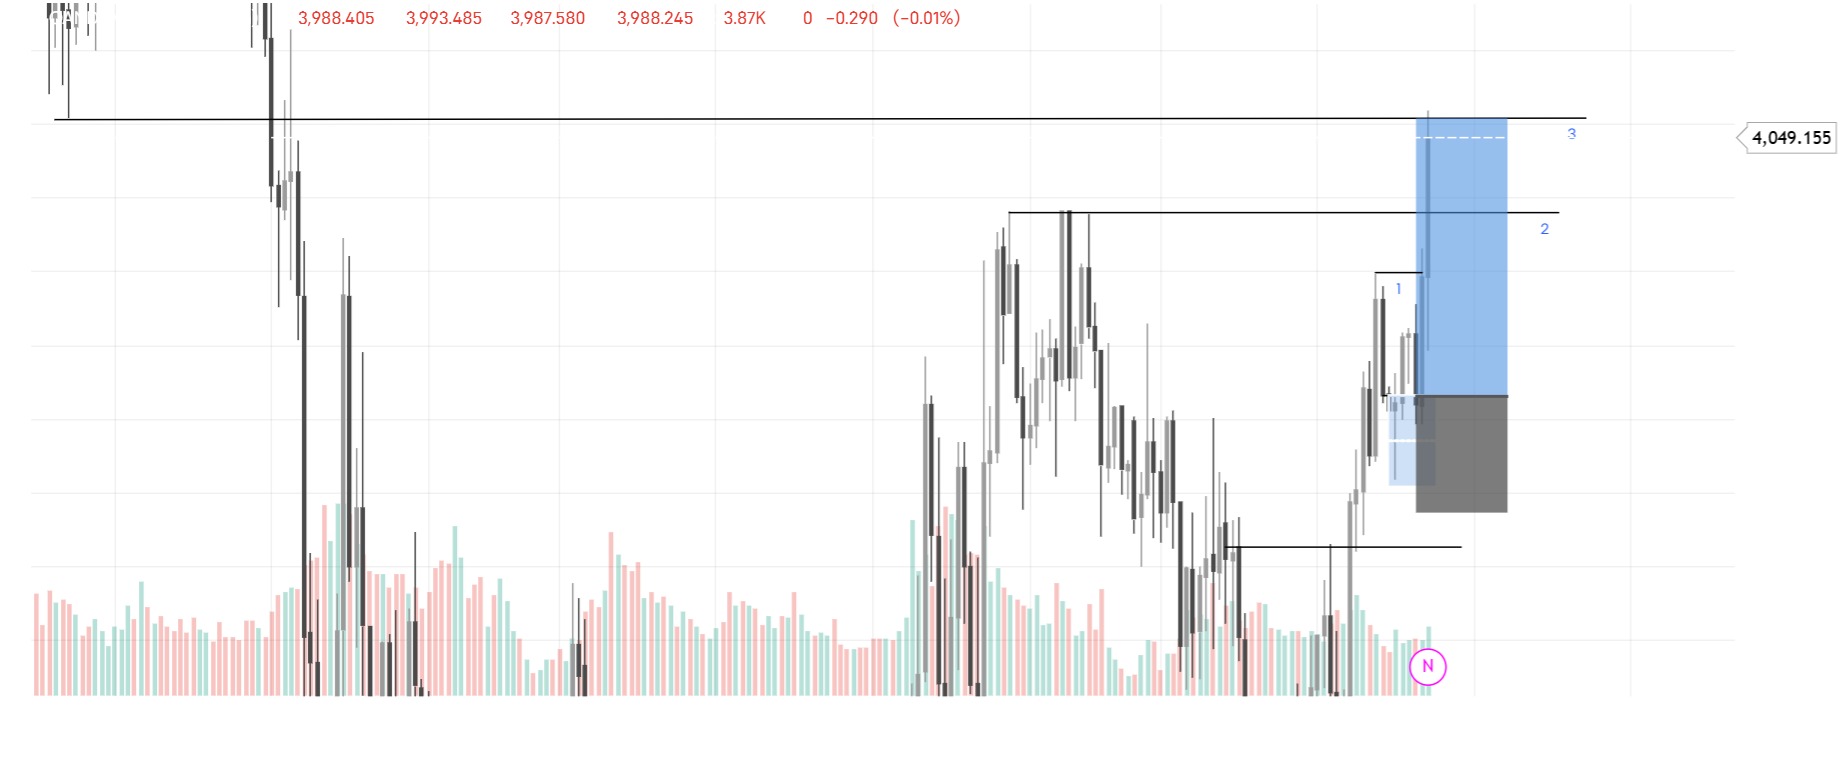
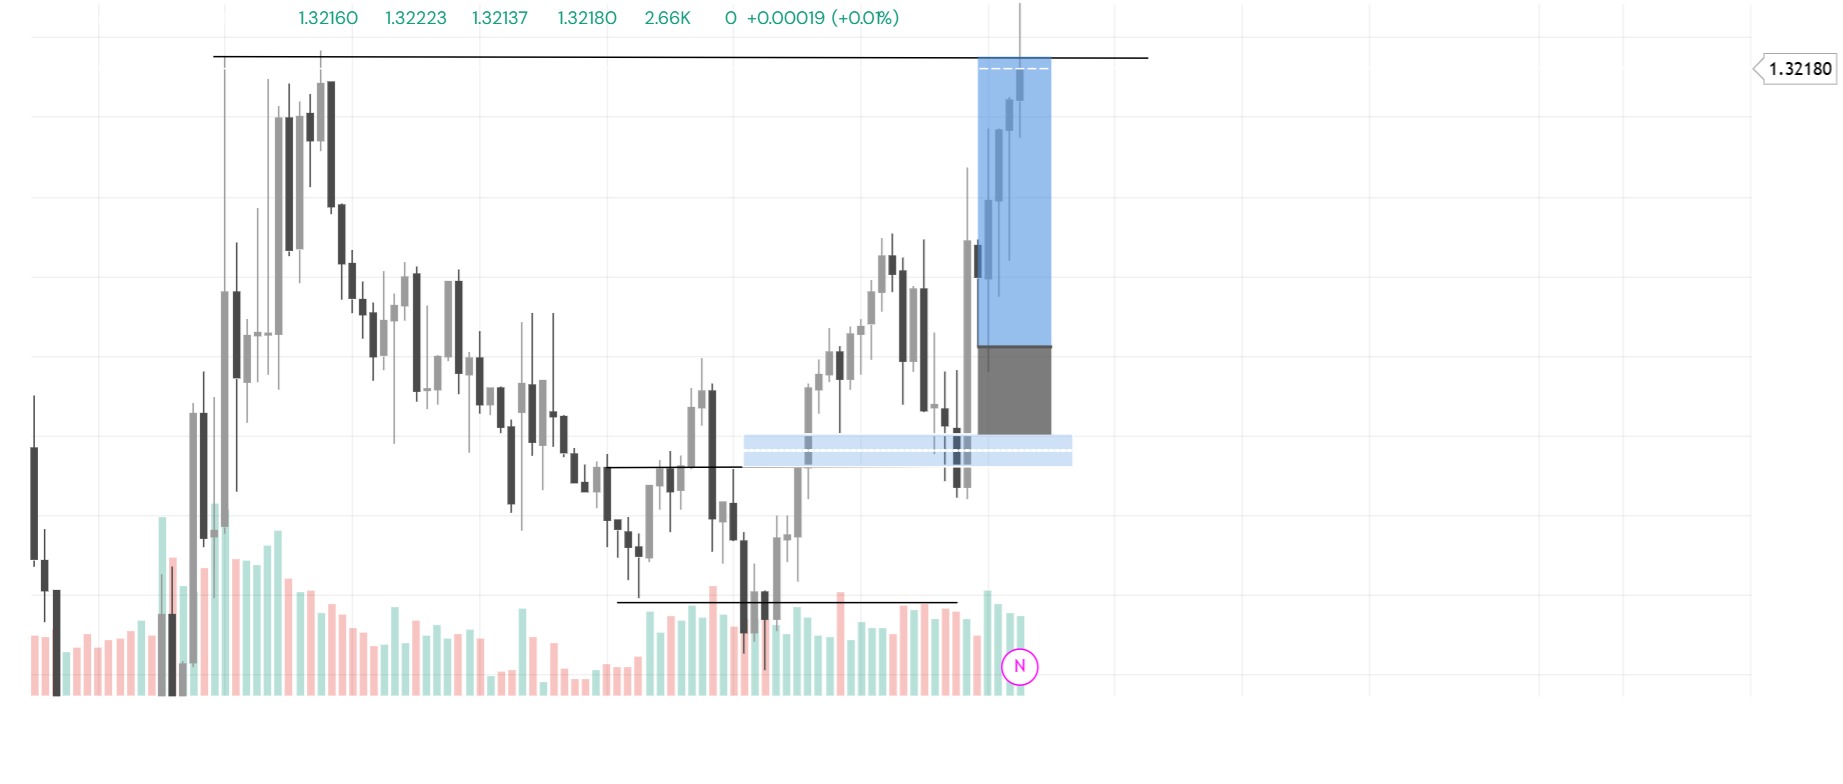
Range for 2000 points
Support holds the floor. Resistance marks the ceiling. Trade the levels. Trust the price." A simple truth every trader lives by — price bounces from support, rejects at resistance. Those two lines are your ma

🎯 Lecciones de Hoy: TP en XAUUSD– Así es el juego real
📊 XAUUSD - Análisis rápidoEl precio mantiene una tendencia bajista en el corto plazo y actualmente está realizando un retroceso hacia una zona de oferta (Order Block) marcada.🎯 Mientras el precio se mantenga debajo de esa zona, el escenario más probable sigue siendo la continuación bajista.⚠️ La paciencia será clave. Lo ideal es esperar confirmación de rechazo en la zona antes de buscar ventas.Sesgo actual: 🔴 Bajista hasta que el precio recupere y cierre por encima de la zona marcada.

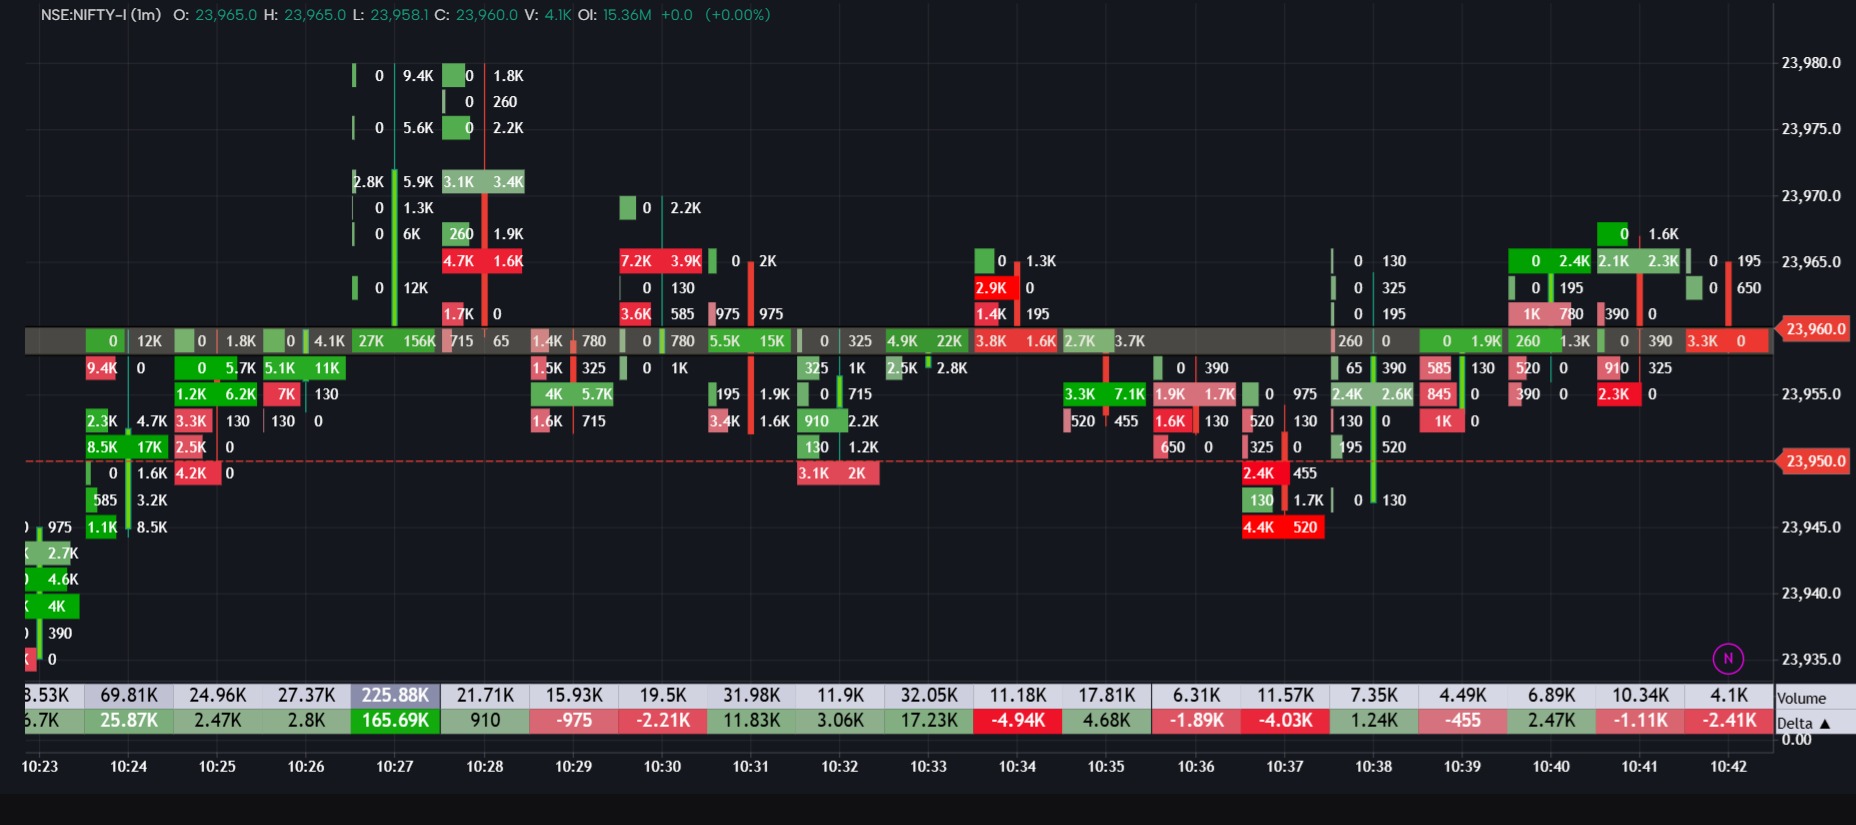
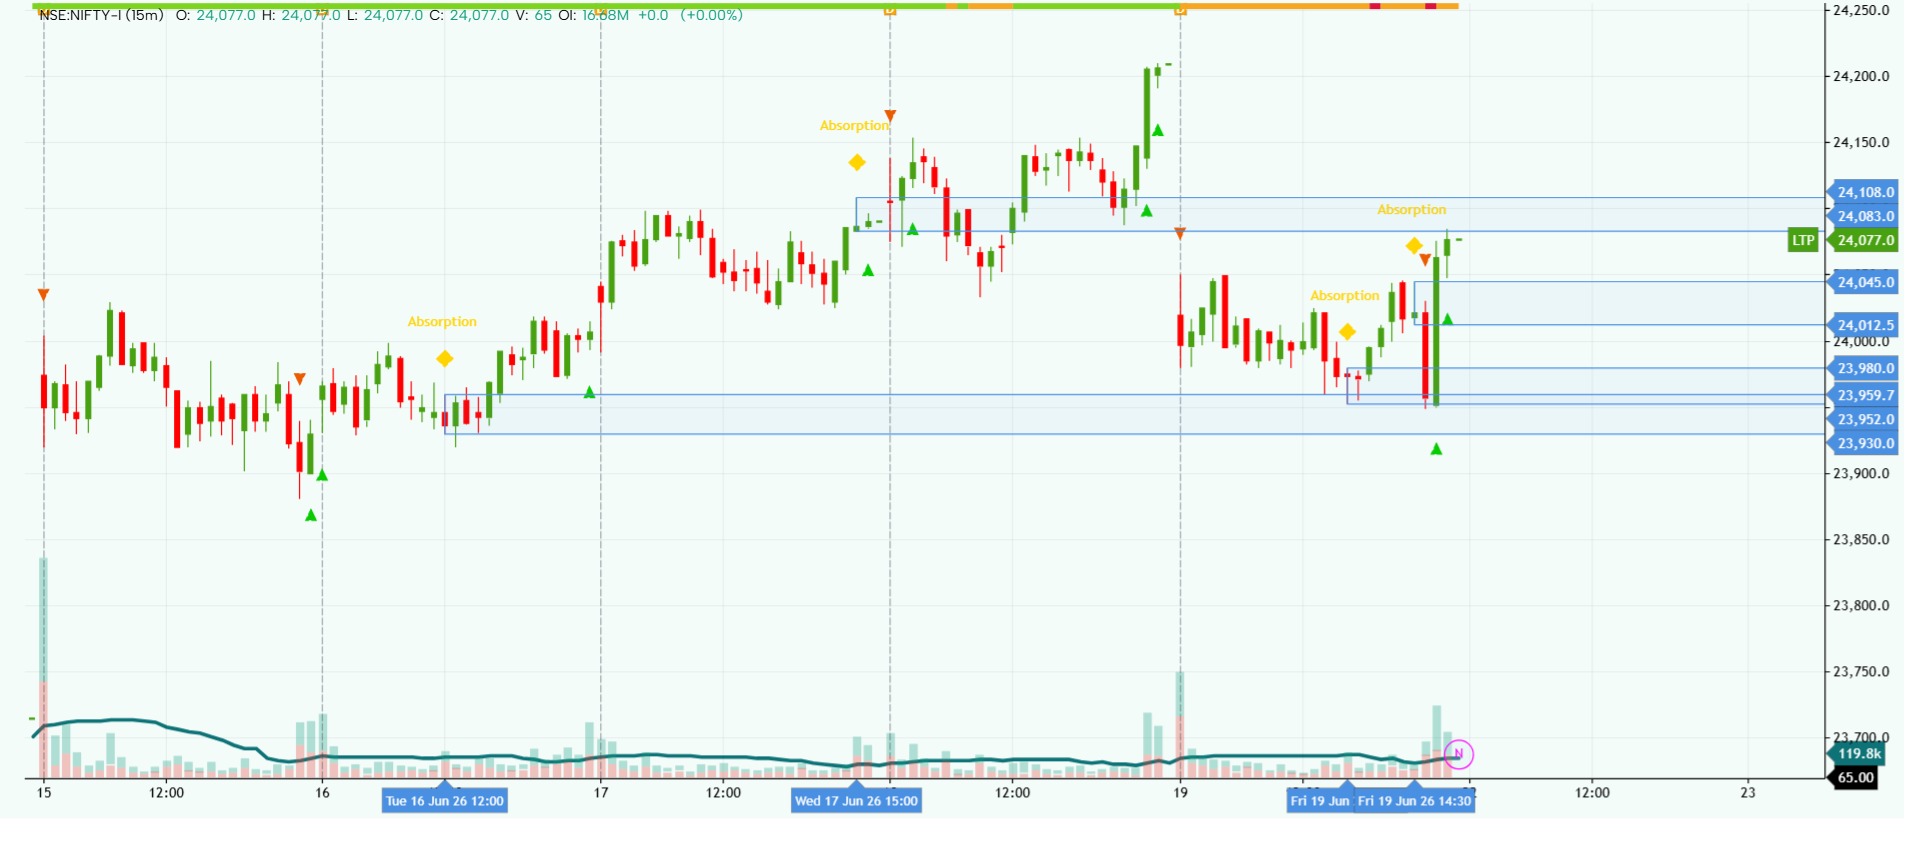
nifty

 Bullish
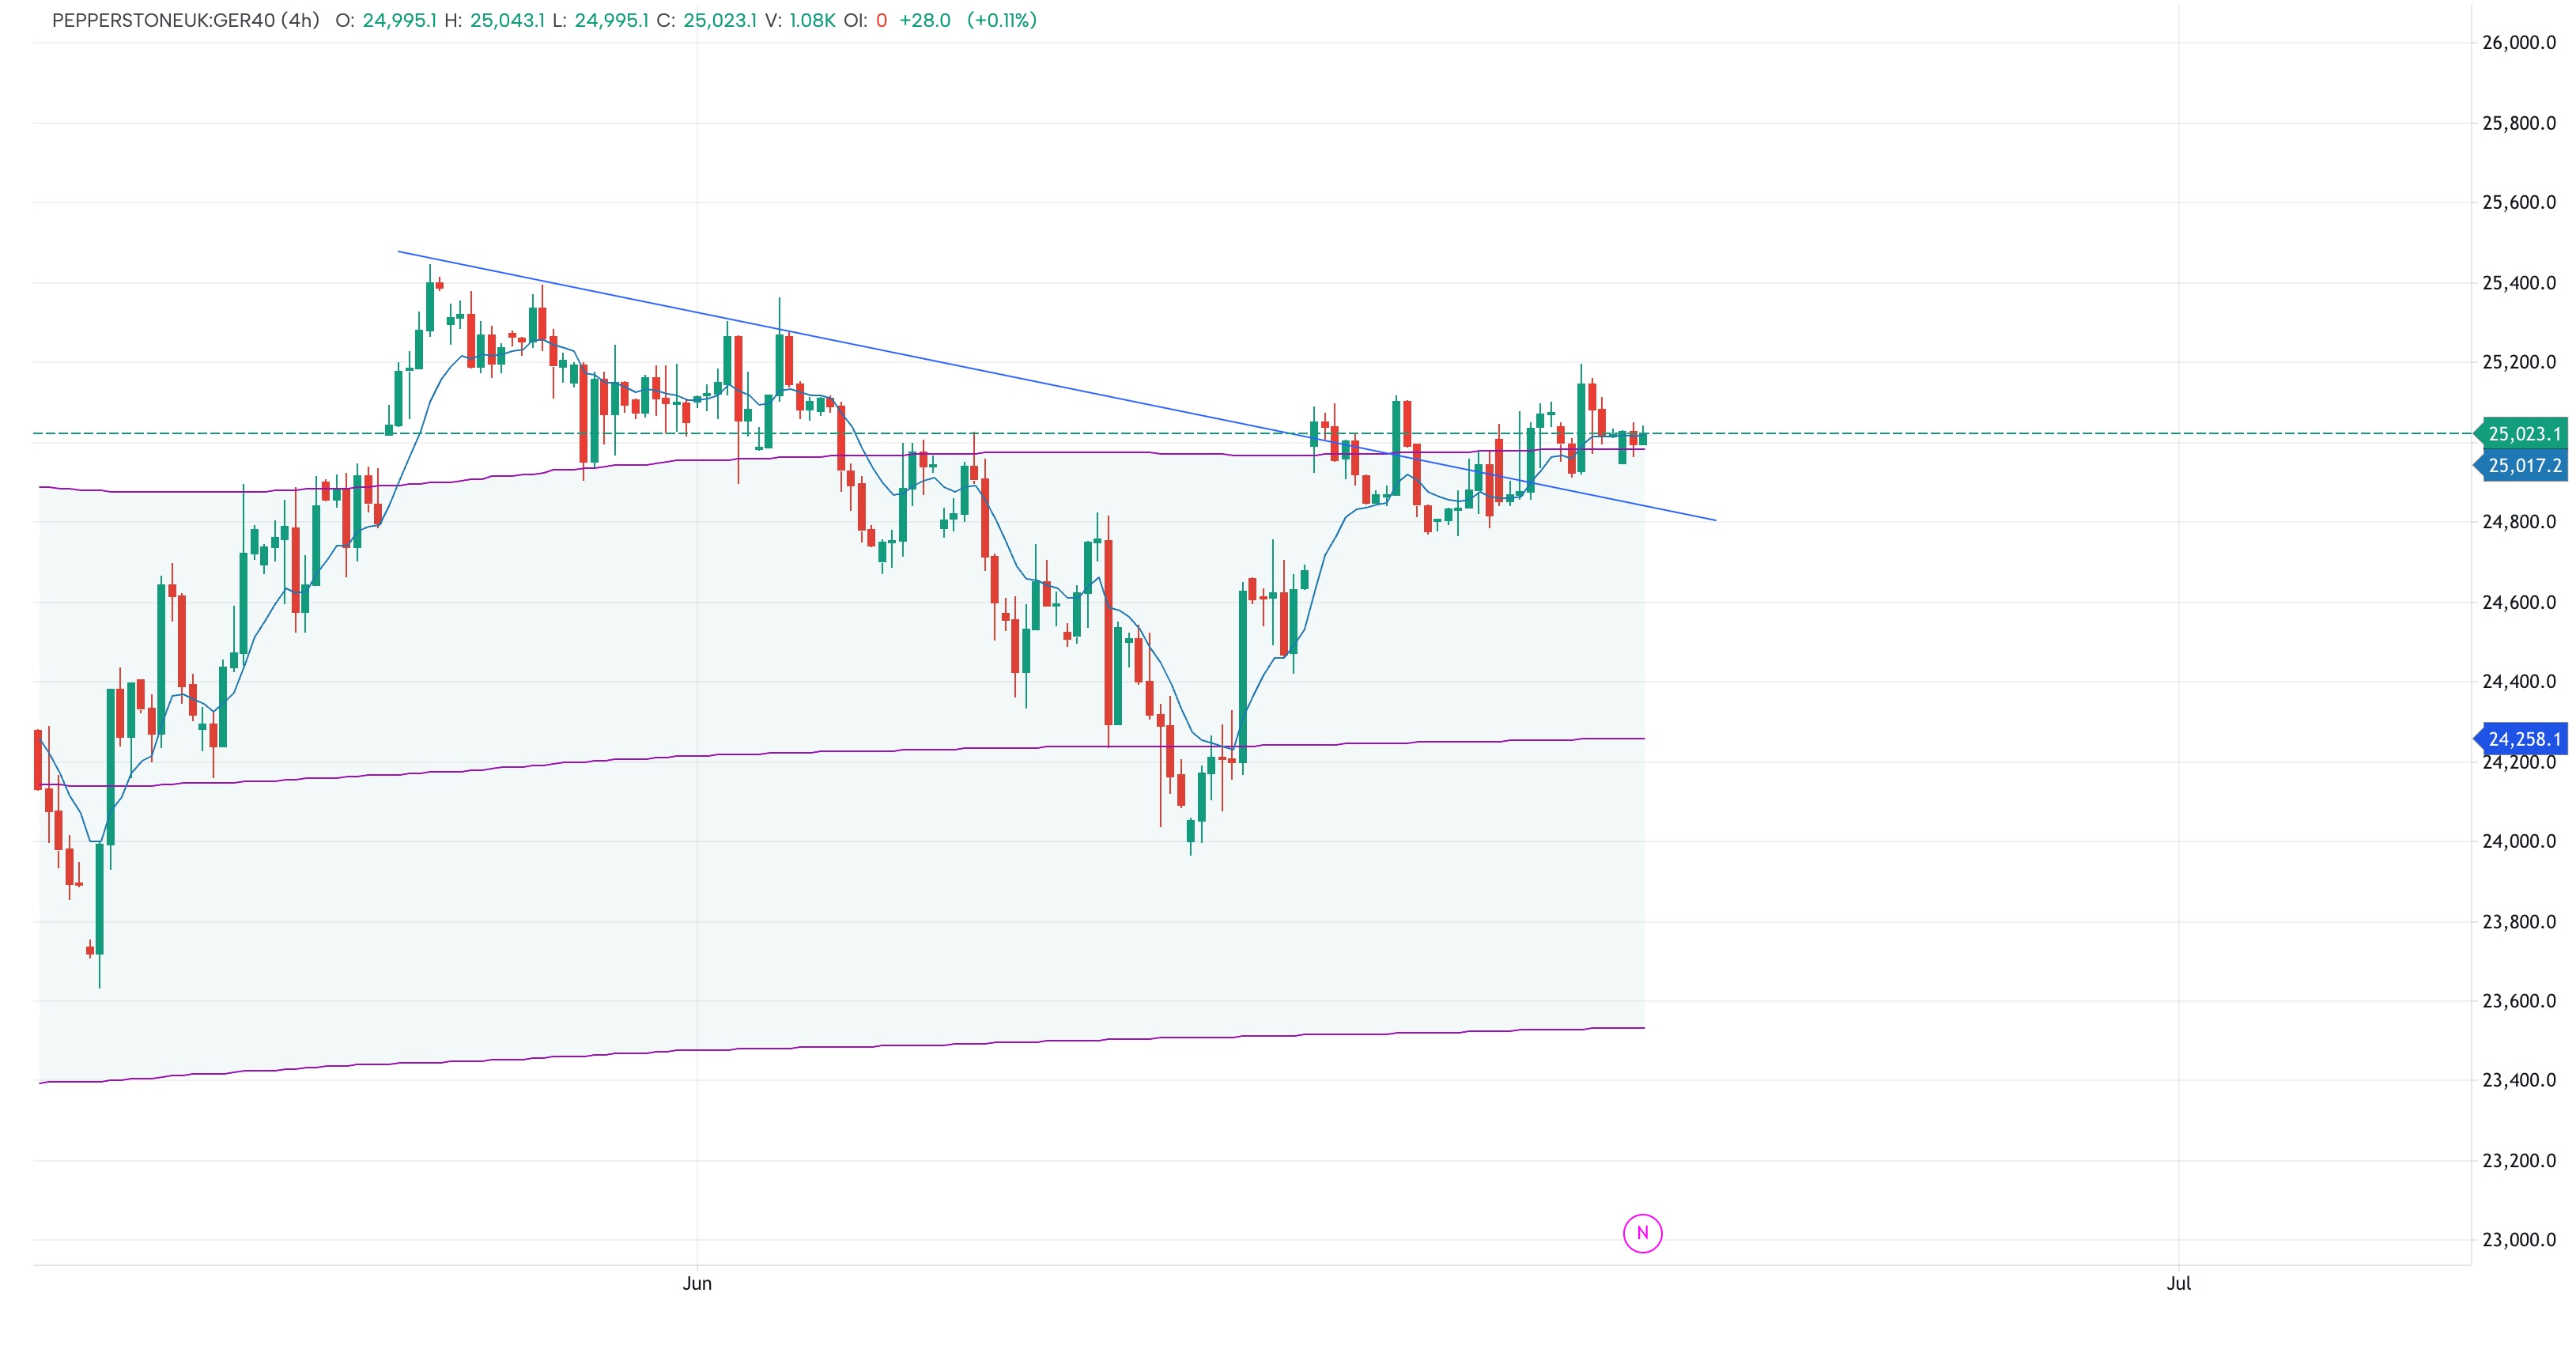
Ger40 22 jun, 2026
Ger 40 break recent trend and holding above the quarterly vwap. which look very bullish on 4h timeframe but quarterly vwap is near to ending so i will Take profit shortly

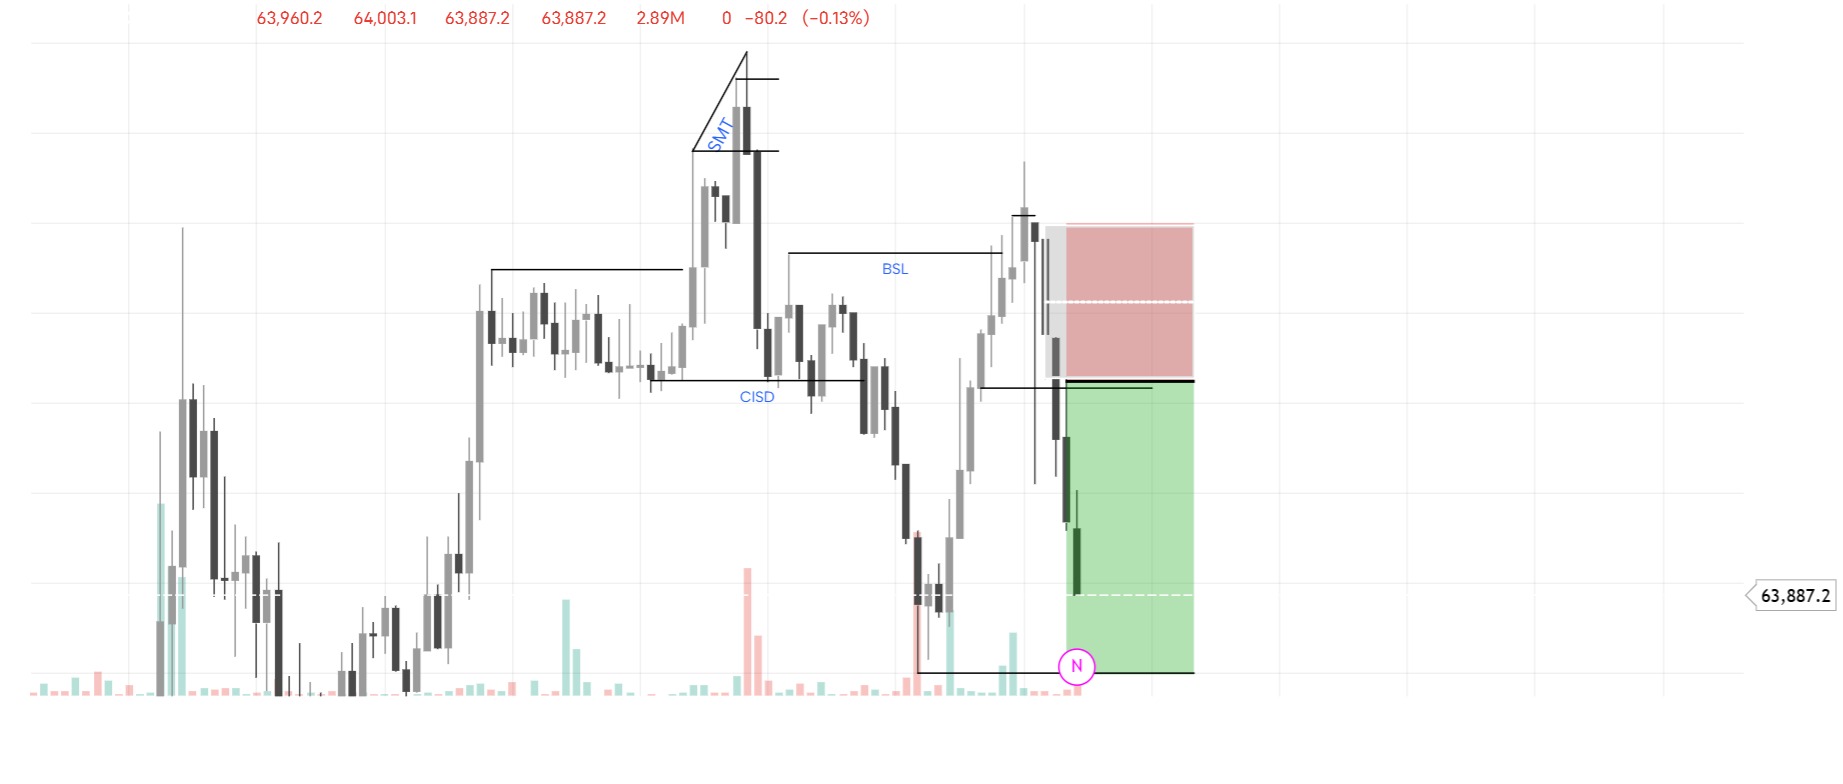
4H BEARISH SMT MOVE
4H ANALYSIS BIAS(FOUND SMT ON IT) 1H CONFIRMATION ON 4H SMT BIAS ANALYSIS 15M BUY SIDE LIQUIDITY, CIAHNGE IN THE STATE OF DELIVERY AND 15M ENTRY

MARKET SEEMS BULLISH. OIL PRICES WILL SPIKE UP AGAIN.
Market Outlook: Bullish Bias on Metals and Energy My current bias is bullish, particularly on metals and energy. The reasoning is primarily based on the relationship between geopolitical risk, dollar strength, and investor sentiment. Looking back at the previous major geopolitical escalation around the Strait of Hormuz, the market reacted alongside significant political developments in Iran. Because those events occurred over the weekend, markets were unable to price the news immediately, resulting in a strong reaction once trading resumed. At that time, the U.S. dollar strengthened considerably. A stronger dollar generally puts pressure on gold and other commodities, which explains why gold corrected despite the geopolitical uncertainty. However, the current situation appears different. Although tensions surrounding the Strait of Hormuz have resurfaced, we are not seeing the same level of dollar strength. The dollar's ability to attract safe-haven flows seems weaker than before. Over the past several months, policy uncertainty, political noise, and frequent market-moving statements have reduced investor confidence and created higher volatility. As a result, investors may increasingly prefer hard assets such as precious metals and energy commodities rather than relying solely on the U.S. dollar as a safe haven. From a price perspective, the 4,500 level appears to be an achievable target in the near term. If the market reaches that level and manages to produce a convincing breakout, the next major objective could be the 5,000 region. Therefore, my base case remains: Bullish on metals. Bullish on energy. Neutral to cautious on the U.S. dollar. Watching the 4,500 level as a key resistance zone. A confirmed breakout could open the path toward 5,000. Of course, this outlook depends on several variables, including geopolitical developments, central bank policy, and dollar strength. Markets remain highly dynamic, so risk management remains more important than prediction.

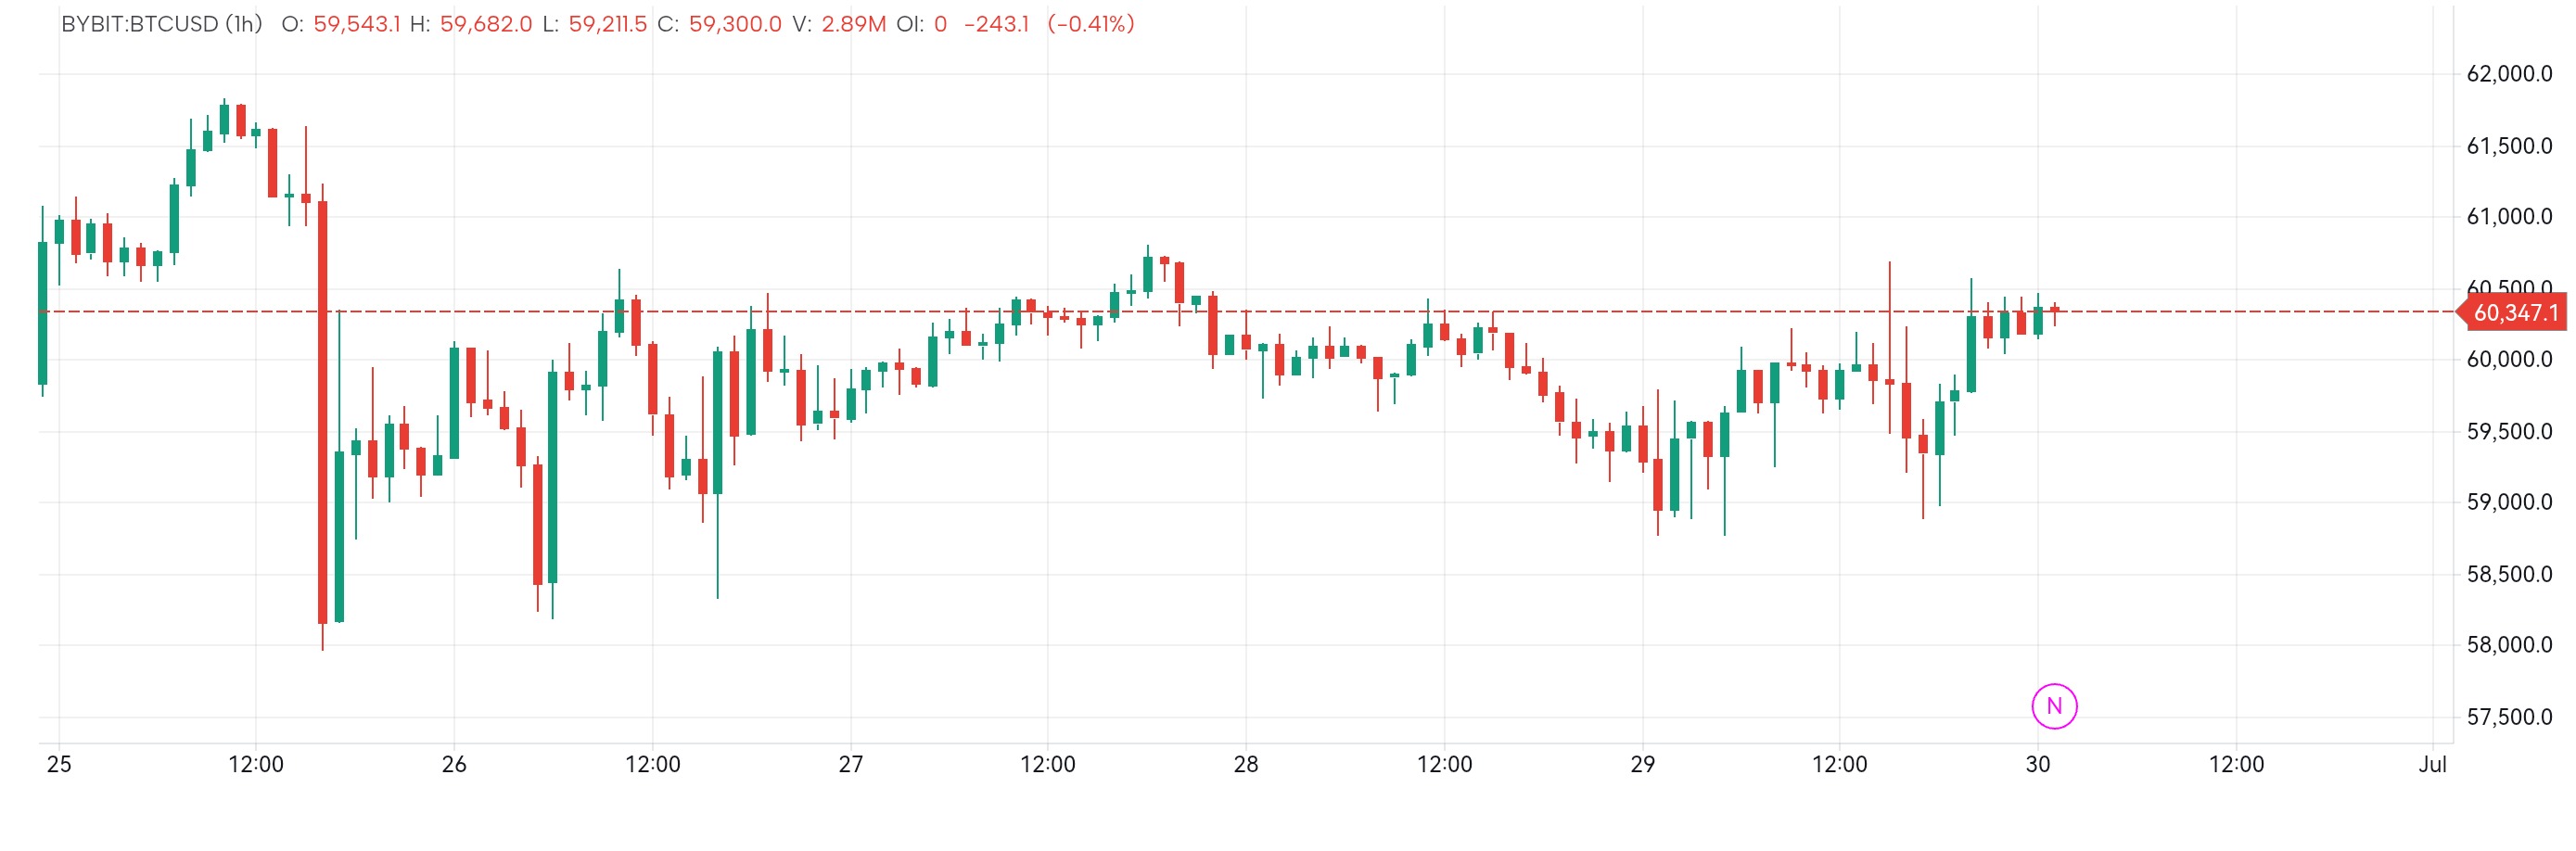
 neutral
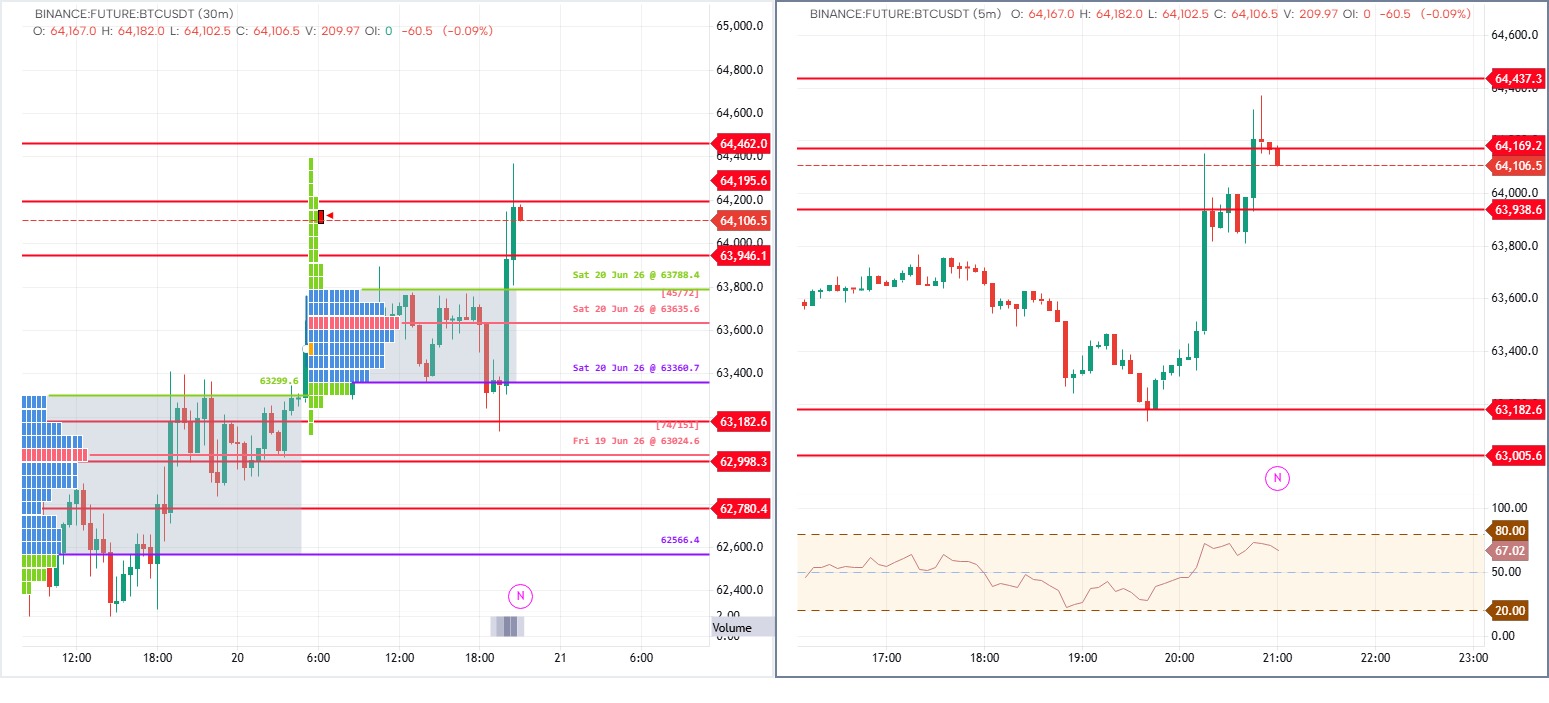
BTCUSD Trade Setup
BTC is trading above support and showing bullish momentum. Price reacted from value area and buyers are active. Key resistance levels are marked on the chart. Trade idea is for educational purposes only.

 neutral
Liquidity Sweep - 15M Time Frame
here's a 15-minute liquidity zone indicator that identifies: Swing High Liquidity (Buy-side liquidity) Swing Low Liquidity (Sell-side liquidity) Liquidity zones extend into the future Optional liquidity sweep detection How it works Red horizontal lines = Buy-side liquidity (above swing highs). Green horizontal lines = Sell-side liquidity (below swing lows). When price: moves above a swing high and closes back below → Buy-side sweep (BSL). moves below a swing low and closes back above → Sell-side sweep (SSL). Best settings for the 15-minute timeframe SettingValueLeft Bars5Right Bars5Zone Extension30–50 bars Possible improvements A more advanced "smart money" liquidity indicator can also include: Equal Highs / Equal Lows (EQH/EQL) Fair Value Gaps (FVG) Order Blocks (OB) Break of Structure (BOS) Change of Character (CHOCH) Liquidity heatmap with dynamic zones Automatic removal of consumed liquidity Multi-timeframe liquidity (1H, 4H, Daily overlaid on the 15m chart) Those features provide a more complete ICT/Smart Money Concepts workflow than simple pivot-based liquidity lines.

 neutral
In search of liquidity
Yesterdays NIFTY-I move a classic example of price coming in search of liquidity... So now what?.. There are three things to look for.. 1) Nifty needs a breakout above 24108 which should sustain for up move 2) OR a breakdown below 23930 for a down move 3) And the third picture.. Nifty could be range bound between 24100-23900 What do you think?.. let me know in the comments

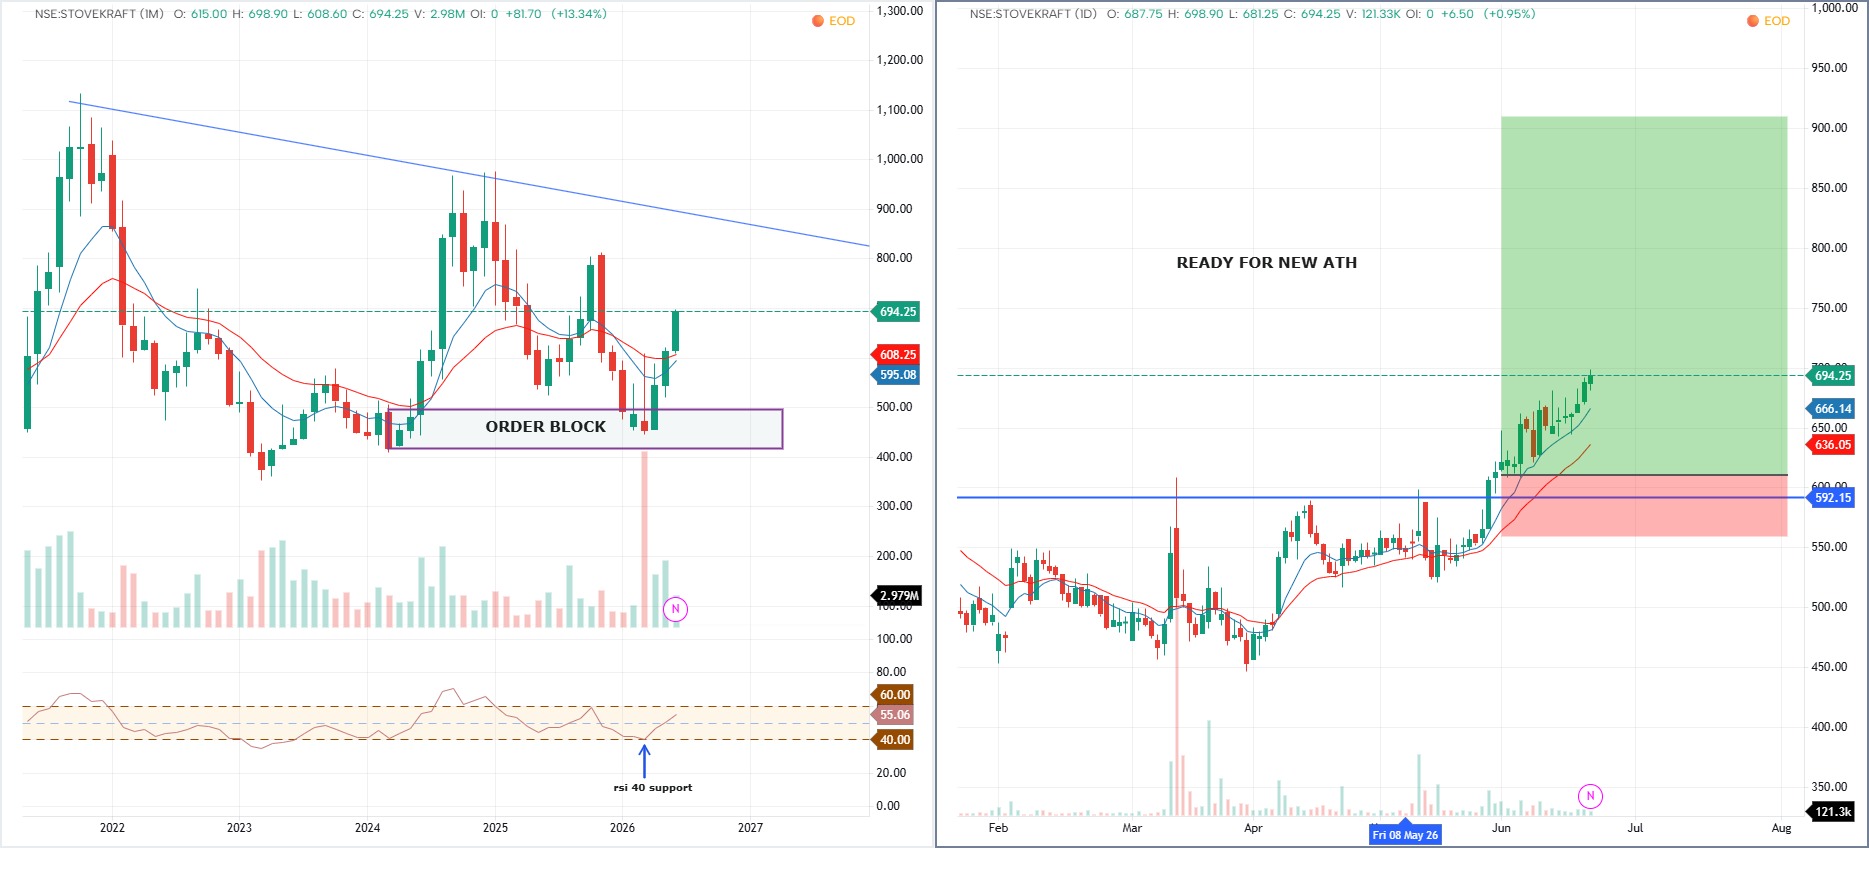 Bullish
stovekraft @694 INVESTMENT PURPOSE
Monthly TF shows a order box zone indicating a sharp reversal of price from bottom . daily TF shows great buying momentum just started and buyers are aggresive at these levels .

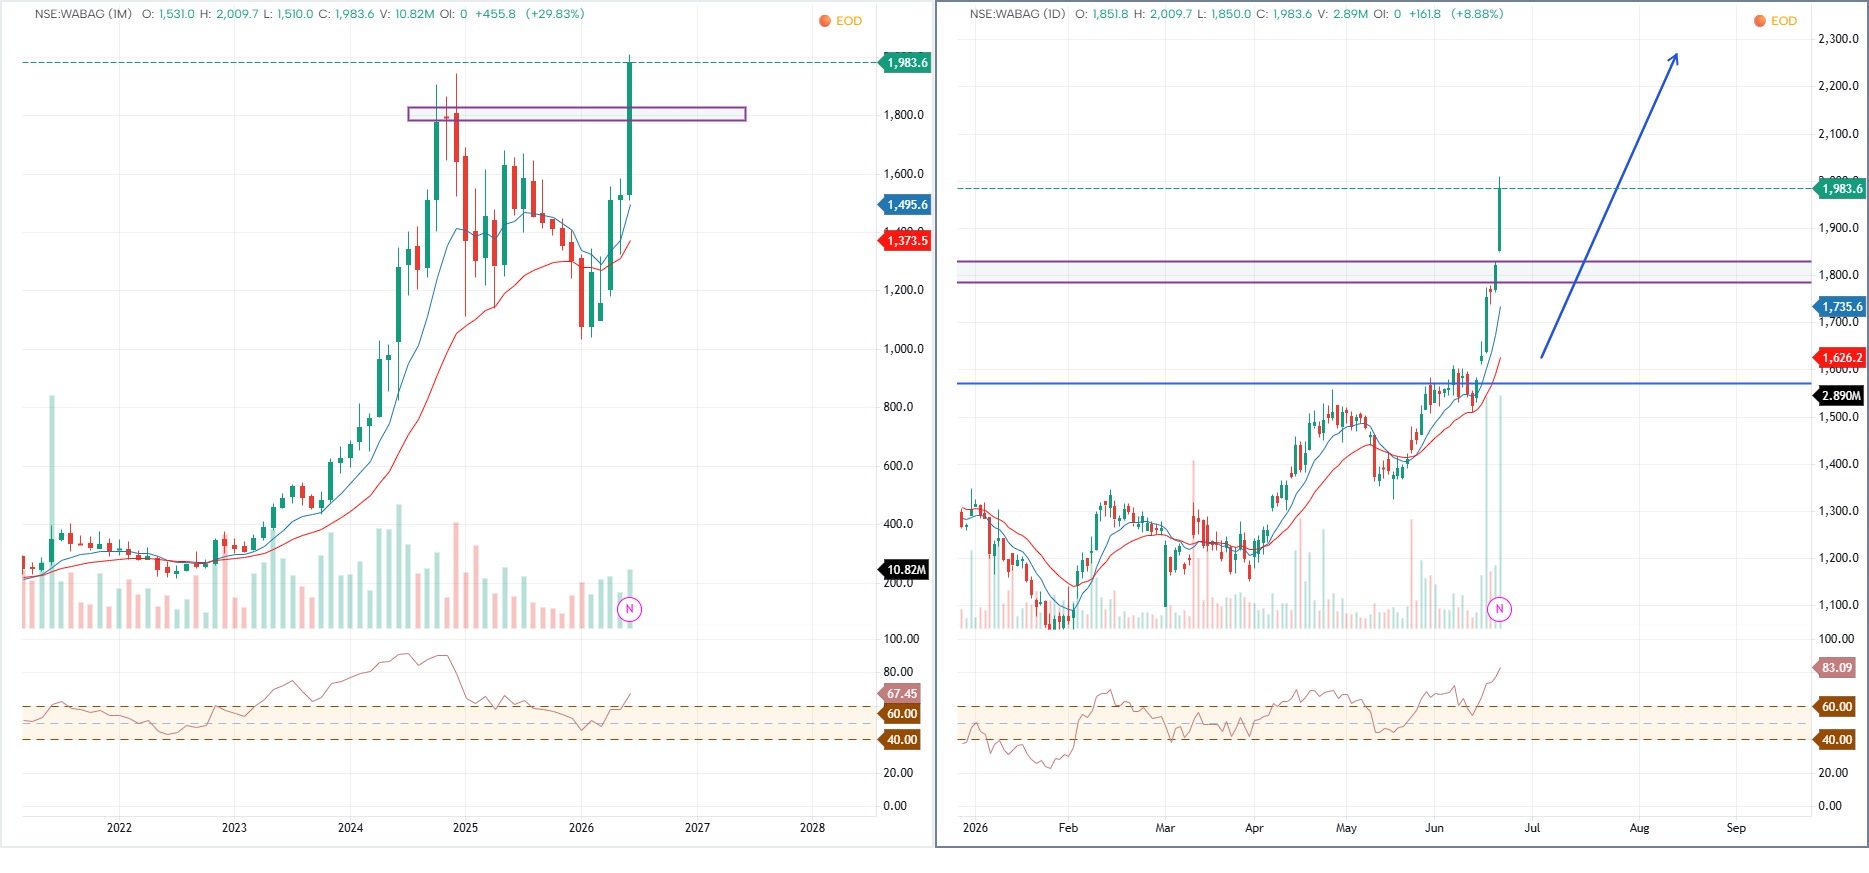 Bullish
VA TECH WABAG for investment purpose
daily and monthly chart shows great strenth , buyers urgency at all time high observed. daily candles shows great strength , new buying entry should be after some consolidation for lesser SL
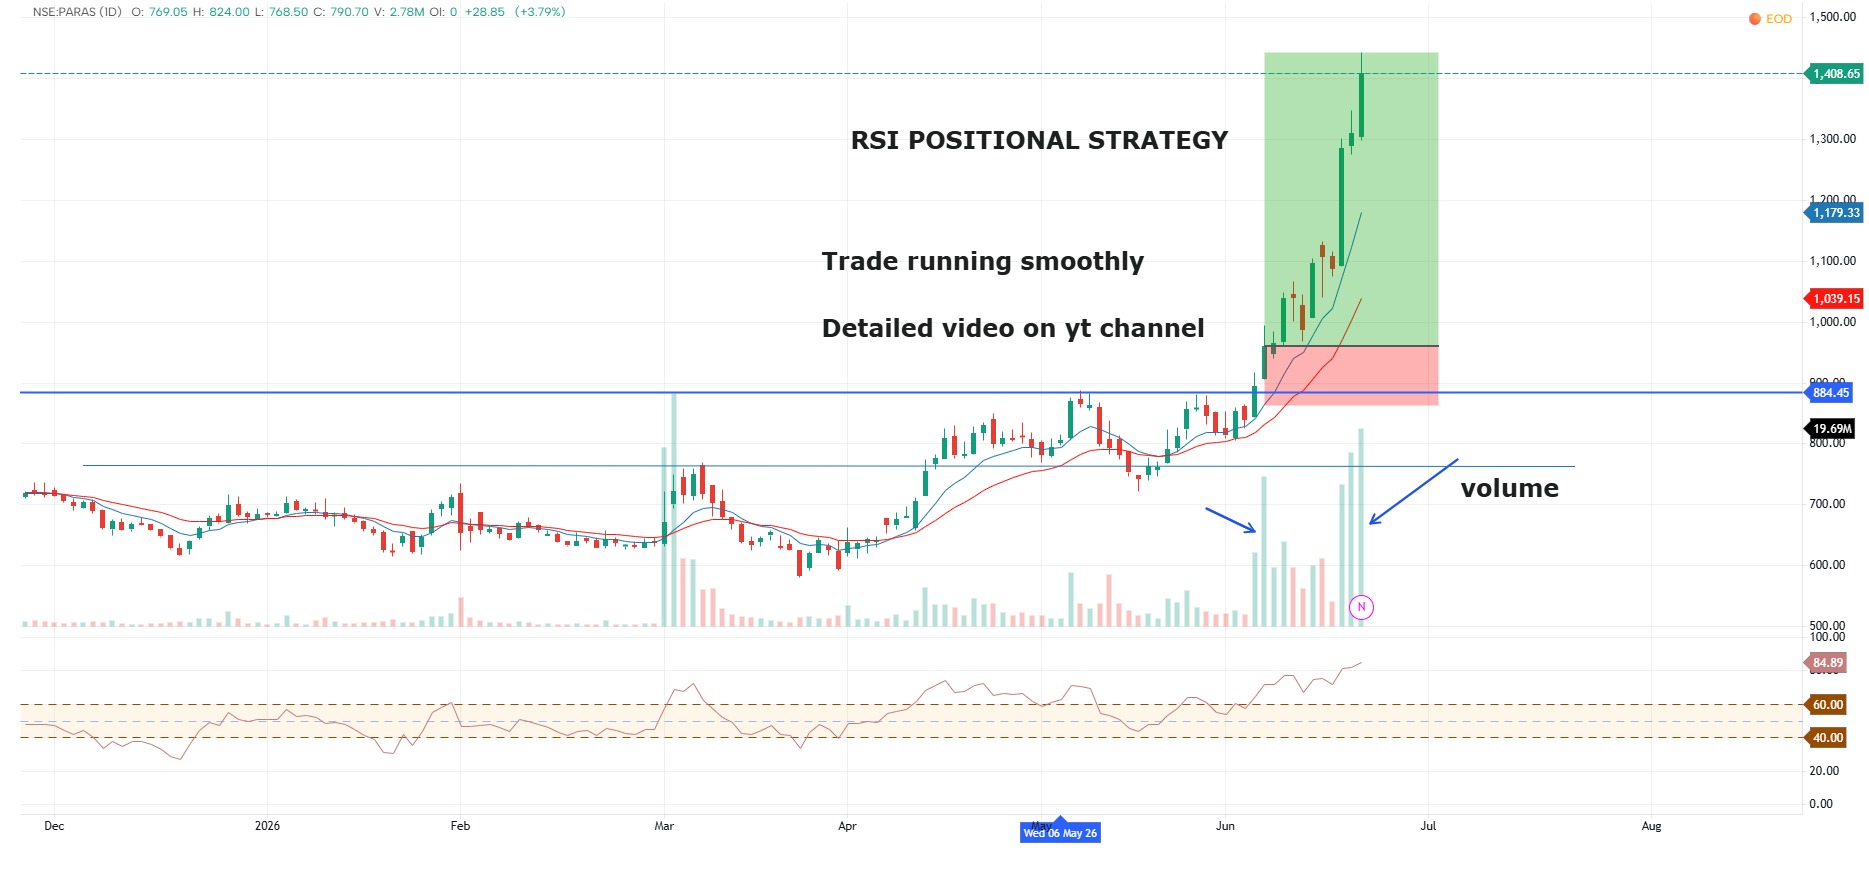
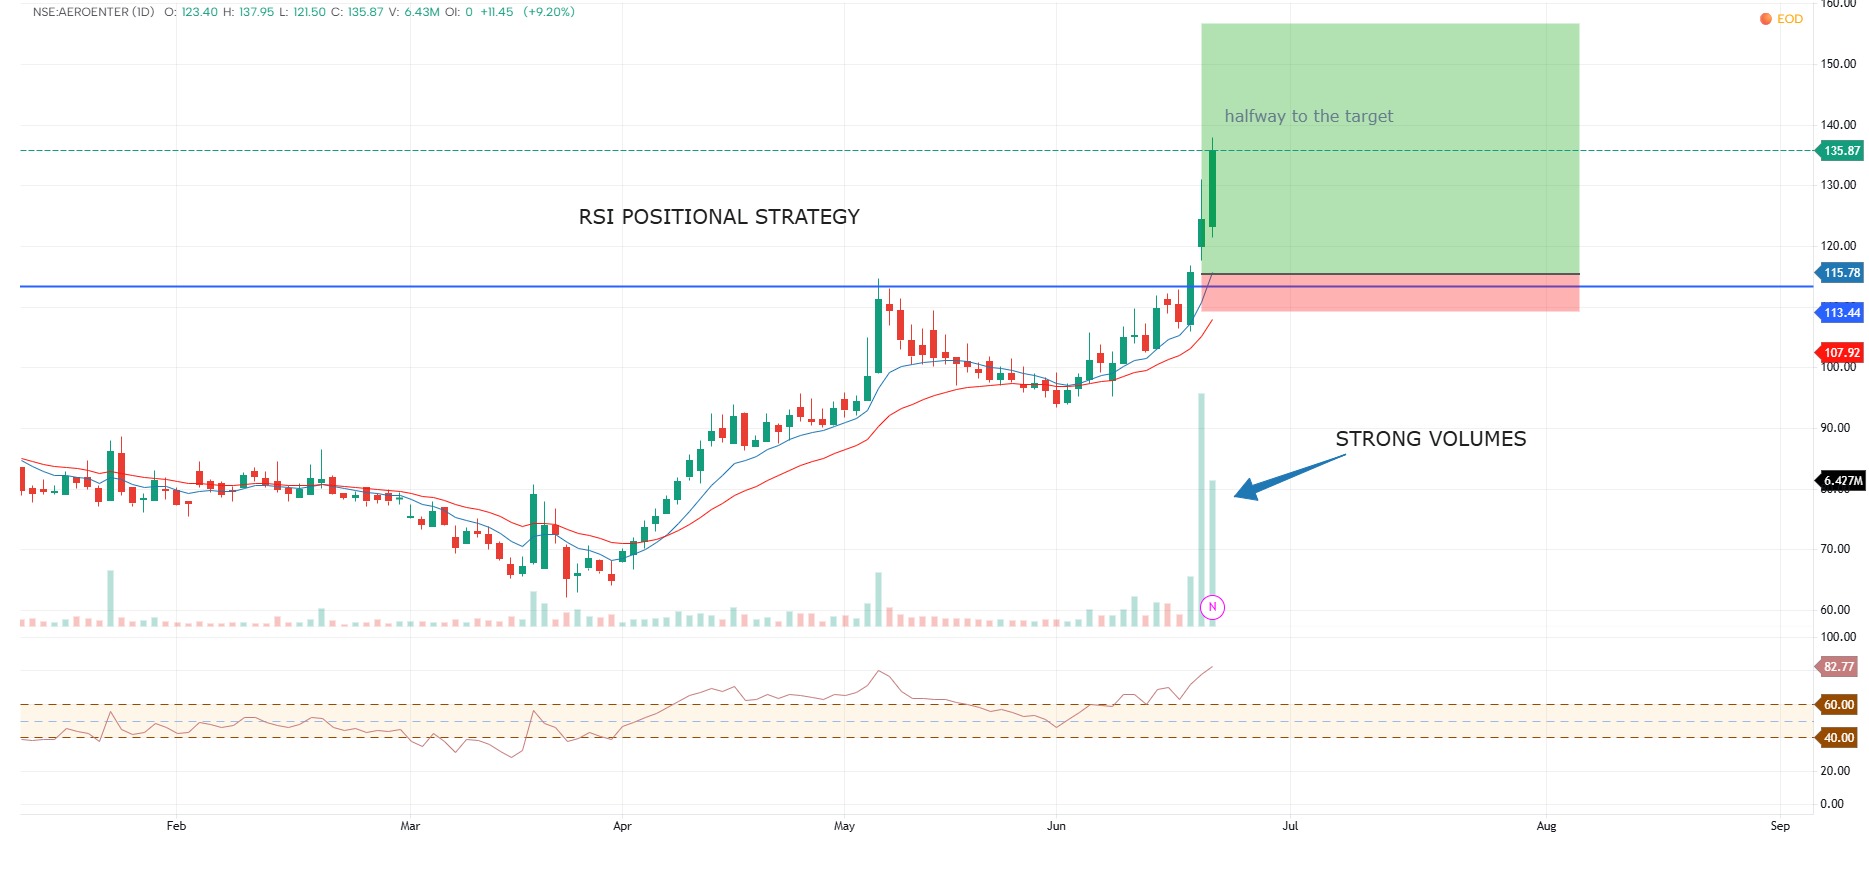
PARAS DEFENCE 50% DONE
entry logic was simple, RSI POSITIONAL STARTEGY Gave us the entry at right levels , ema support was there and stock gave beautiful momentum of 50% in almost 10 days , that was the momentum we were expecting from our rocket stocks

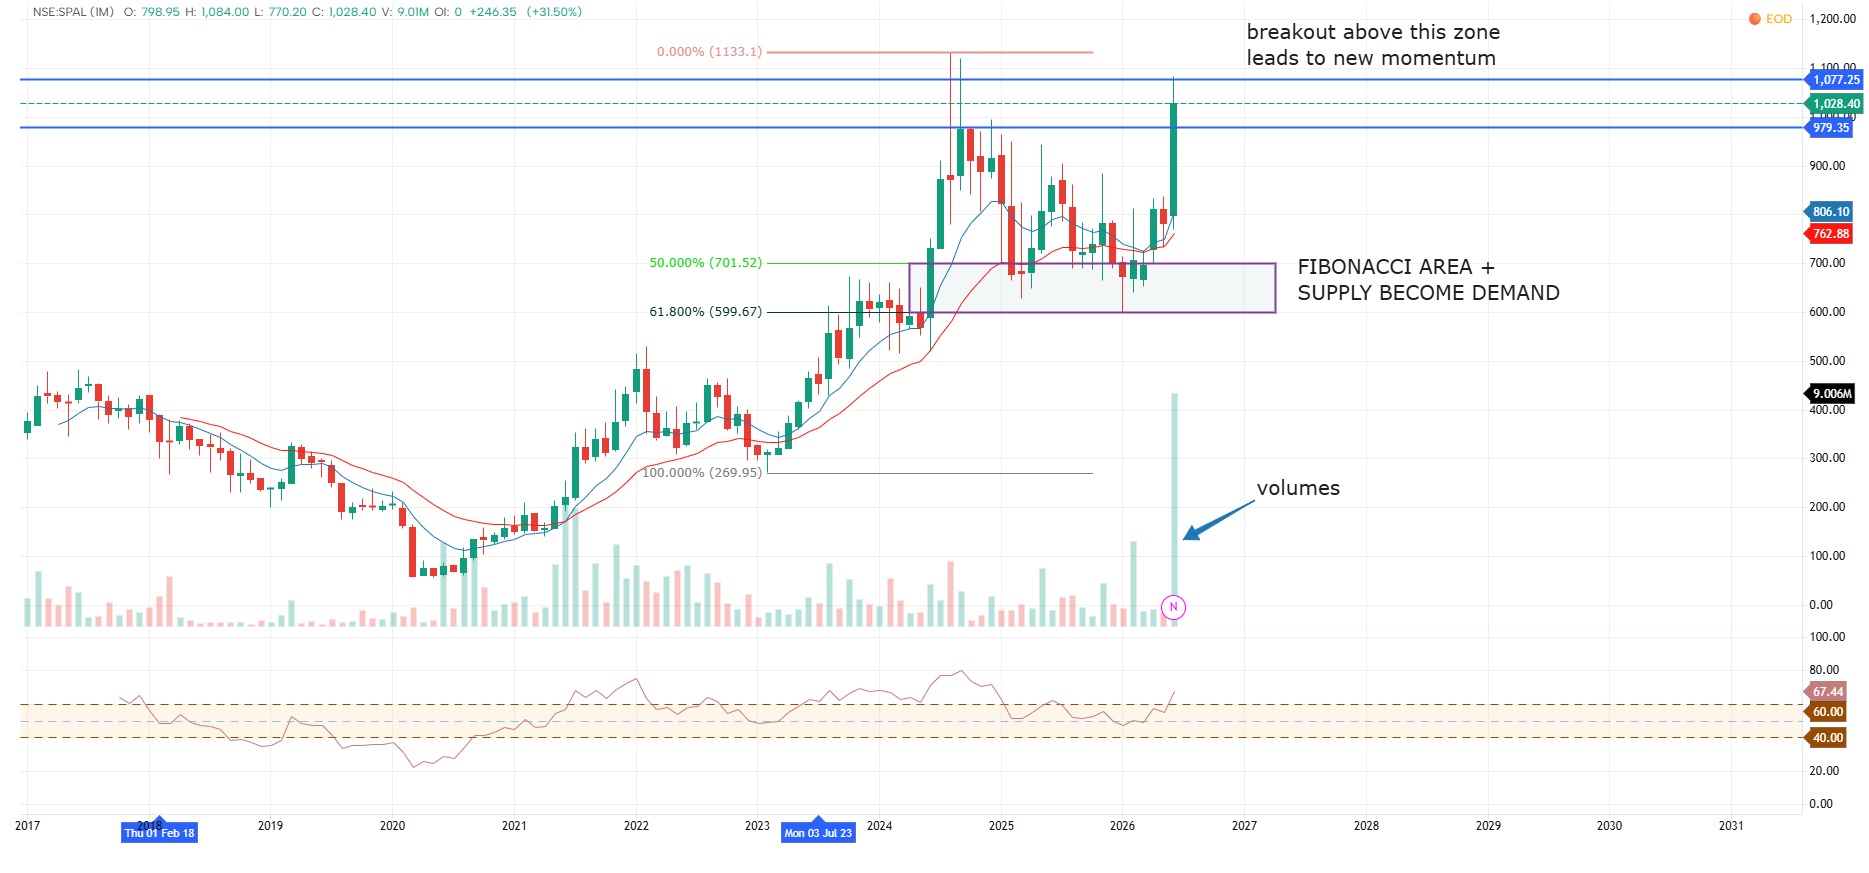 Bullish
SPAL stock analysis for positional trade
stock is trading in rsi strategy zone , currently ready for good momentum ahead , keep on watchlist and follow for more , fibonacci and demand becomes supply area is crucial for reversal and shows strenth at buyers level, ready for new all time high
 Bullish
aeroflex ent for momentum trading
STOCK IS IN UPTREND , HOLDING AT TOP LEVELS , RSI POSITIONAL STRATEGY GIVEN SIGNAL 3 DAYSS AGO , and look at the momentum after that. halfway to tgt , many more to come , join us for more updates
fvg01

Institutional Order Flow Proxy Indicator
Volume Spike Detection (possible institutional activity)✅ Volume Absorption Zones (buying/selling pressure)✅ Fair Value Gap (FVG) / Imbalance Zones✅ Order Block Detection✅ VWAP Reference✅ Liquidity Sweep Detection (stop hunt zones)✅ Alerts
