Delta Divergence with Delta Threshold

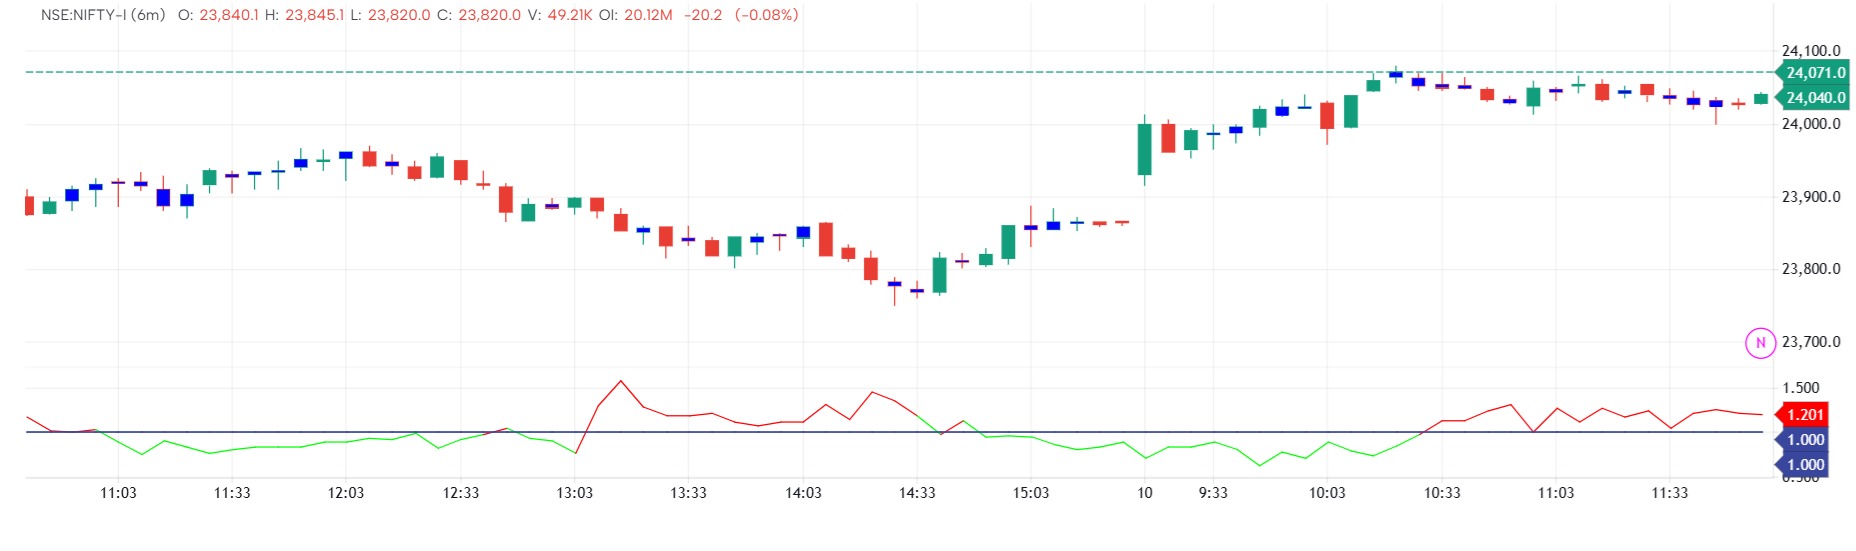
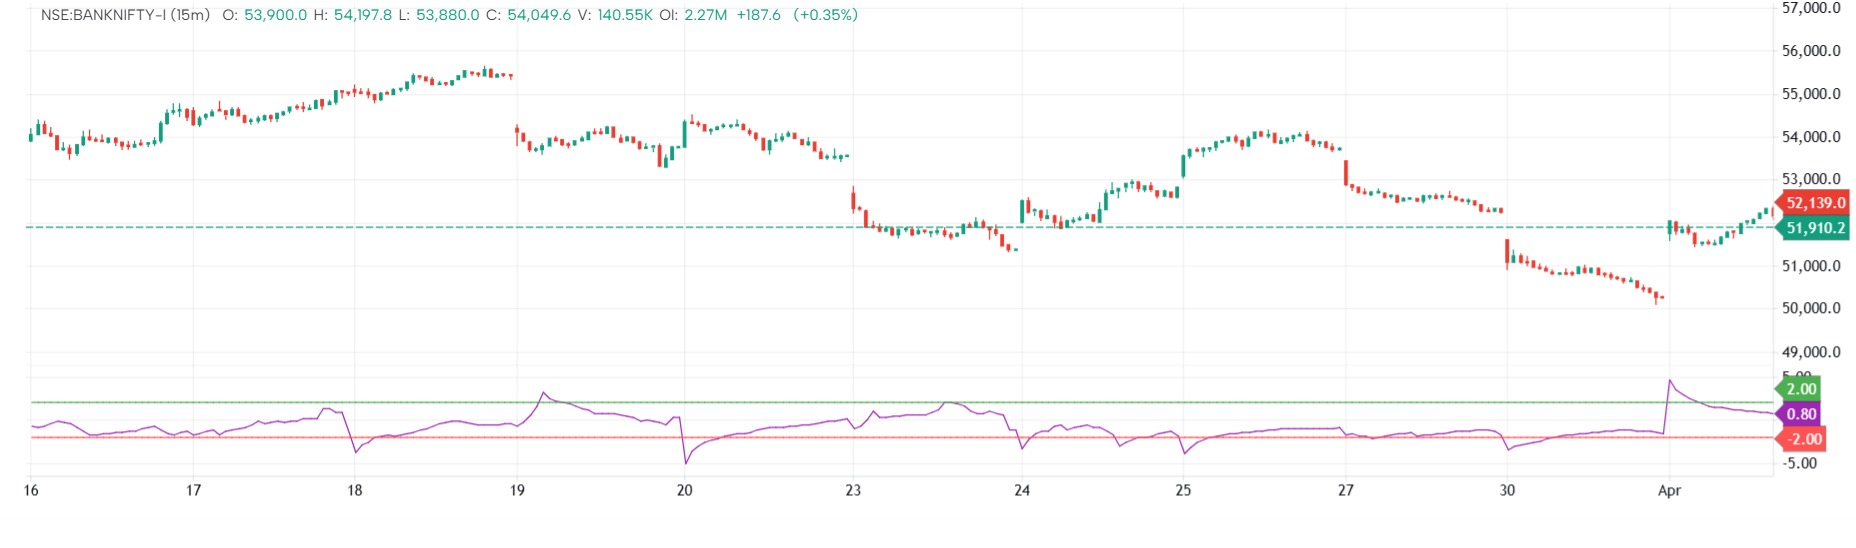
This indicator is designed to identify delta divergence-based reversal opportunities using order flow data.
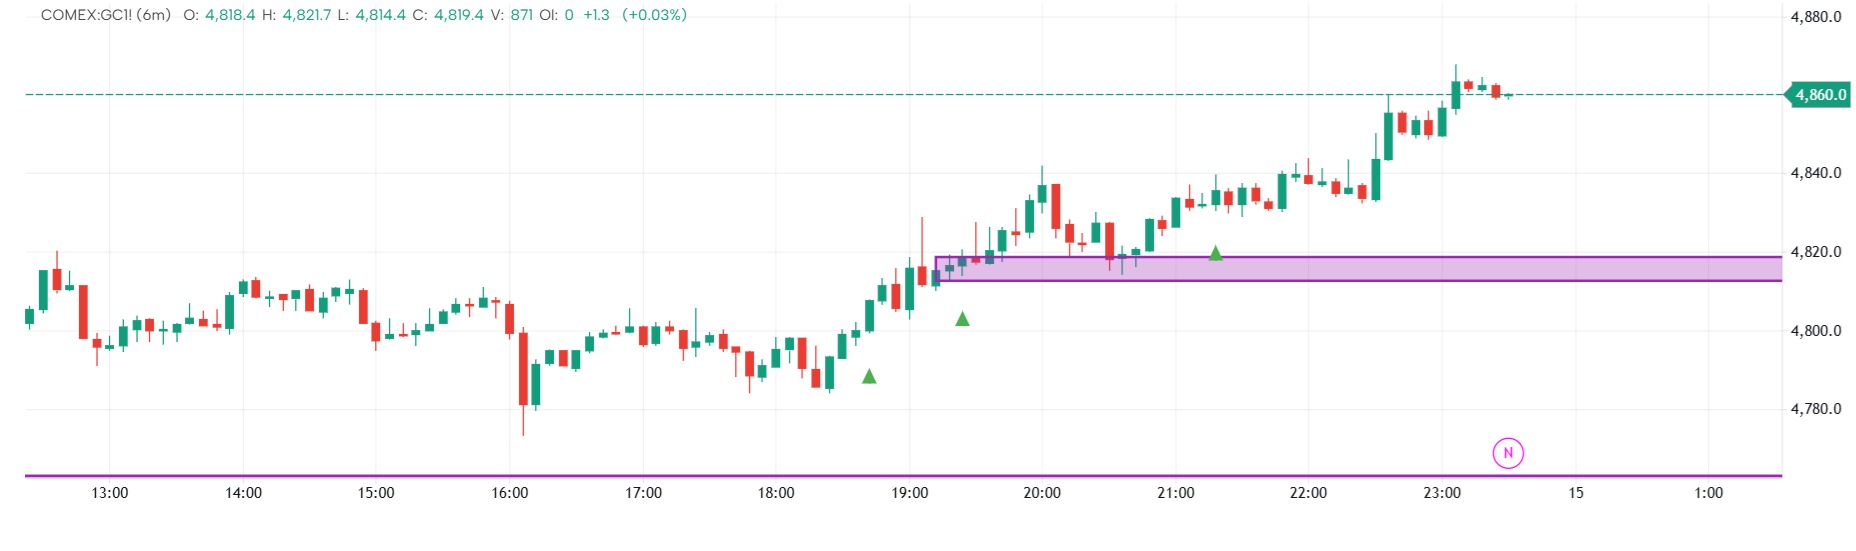
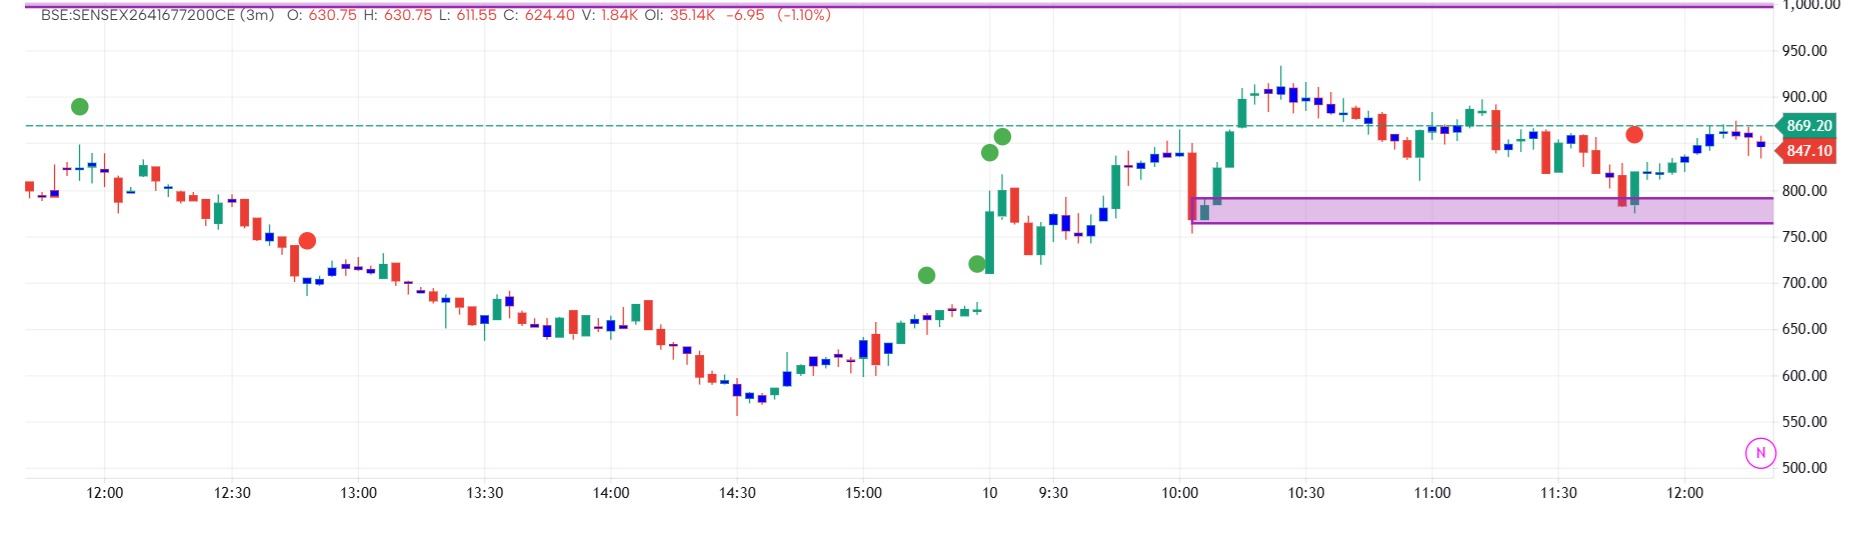
For a buy setup, it first detects a divergence where the price shows strength (a green candle), but the underlying order flow is weak (negative delta). This suggests hidden selling pressure despite price moving up. The next candle must confirm strength by being bullish (green) with a strong delta (at least 90% of the maximum or minimum delta), indicating aggressive buying entering the market. When this confirmation occurs, an up arrow is plotted on the divergence candle, signaling a potential upward move.
For a sell setup, the logic is reversed. It identifies a red candle (price weakness) with positive delta, indicating hidden buying pressure. The following candle must be bearish (red) with a strong imbalance in delta, confirming aggressive selling. A down arrow is then plotted on the divergence candle, signaling a potential downward move.
Overall, the strategy combines price action and order flow imbalance to detect situations where the market may reverse after absorbing opposing pressure, making it useful for spotting high-probability trade entries.
The information and publications are not meant to be, and do not constitute, financial, investment, trading, or other types of advice or recommendations supplied or endorsed by GoCharting. Read more in the Terms of Use.
↗ Related Scripts
Comments (2)
Loading comments…