SNIPER BUY SELL

This script's source code is protected by the author.
SNIPER BUY SELL INDICATOR — ANALYSIS, DESCRIPTION & USER GUIDE
📊 Overview
BBMA Sniper is an advanced trading indicator based on the BBMA (Bollinger Bands + Moving Average) methodology. It is designed to identify high-probability entry points by combining:
- Bollinger Bands (volatility)
- EMA50 (trend direction)
- WMA 5 & 10 (dynamic support/resistance)
- Momentum & Extreme detection
- Reentry confirmation (Sniper logic)
This system focuses on precision entries (Sniper mode) with fewer but higher-quality signals.
🧠 Core Concept (How It Works)
The indicator follows a structured market flow:
EXT → MOMENTUM → REENTRY (SNIPER ENTRY)
1. EXTREME (EXT)
- Market is overbought or oversold
- Indicates potential exhaustion or continuation setup
2. MOMENTUM (MMT)
- Strong breakout beyond Bollinger Bands
- Confirms market strength
3. REENTRY (SNIPER)
- Price pulls back to MA zone (WMA 5/10)
- Entry occurs in direction of trend
👉 The system only triggers entries when conditions align, reducing noise and false signals.
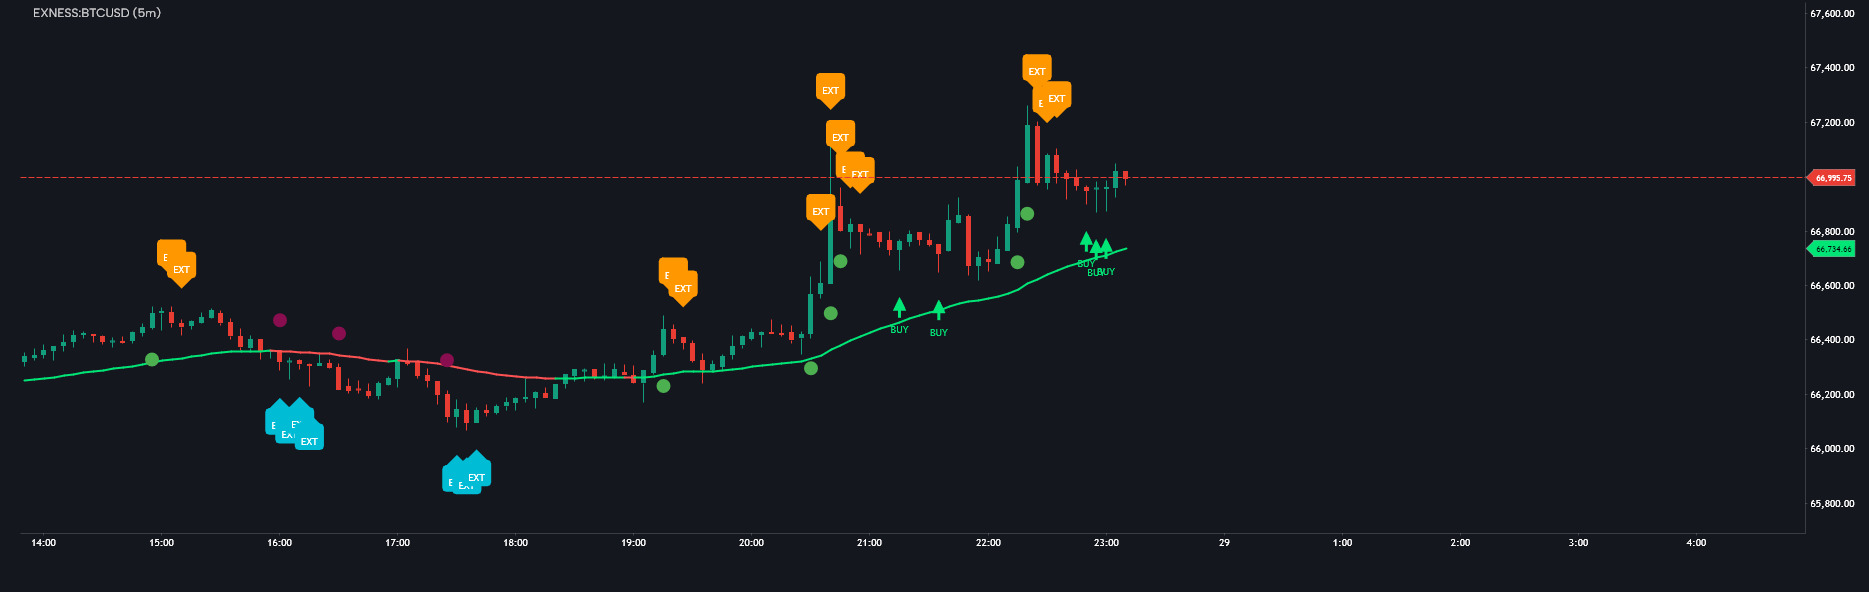
🎯 Signal Types
🟢 BUY Signal
- Appears as a green arrow
- Conditions:
- Price above EMA50 (uptrend)
- Valid momentum occurred before
- Pullback to MA zone
- Not in sideways market
🔴 SELL Signal
- Appears as a red arrow
- Conditions:
- Price below EMA50 (downtrend)
- Valid momentum occurred before
- Pullback to MA zone
- Market trending
🔵 / 🟠 EXT Labels
- Mark extreme conditions
- Useful for anticipating reversals or continuation setups
🚀 How to Use (Step-by-Step)
✅ BUY Setup
- Wait for price above EMA50
- Look for EXT or Momentum
- Wait for BUY signal (green arrow)
- Enter at candle close
❌ SELL Setup
- Price below EMA50
- Look for EXT / Momentum
- Wait for SELL signal (red arrow)
- Enter at candle close
🛑 Stop Loss (SL)
BUY:
- Place SL below WMA10 Low (ma10L)
SELL:
- Place SL above WMA10 High (ma10H)
💰 Take Profit (TP)
TP Strategy:
- TP1: Middle Bollinger Band (mid)
- TP2: Opposite BandTradeTP1TP2BUYMid BBUpper BBSELLMid BBLower BB
📈 Best Trading Strategy
🔥 Recommended Approach:
- Close 50% at TP1
- Let remaining 50% run to TP2
This approach:
- Locks profit early
- Maximizes trend potential
⚠️ Important Rules
Avoid trades when:
- Market is sideways (flat Bollinger Bands)
- No prior momentum
- Candle size is small (low volatility)
💡 Pro Tips
- Best signals occur after EXT → Momentum → Reentry
- Higher timeframe confirmation increases accuracy
- Works best in trending markets
📞 Contact & Support
Telegram: @Dianfuji
Link: https://t.me/Dianfuji
🚀 Final Note
This indicator is built for precision trading, not frequent trading.
👉 Fewer signals
👉 Higher probability
👉 Better risk management
Use it with discipline and proper risk control for best results.
The information and publications are not meant to be, and do not constitute, financial, investment, trading, or other types of advice or recommendations supplied or endorsed by GoCharting. Read more in the Terms of Use.
↗ Related Scripts
Comments (4)
Loading comments…